
Environmental Injustice Is Real in New Jersey: Introducing This Project
The claim
In New Jersey, pollution and environmental hazards fall hardest on low-income communities and communities of color. That is the starting point for this project. It isn’t just my opinion. It’s supported by decades of research, by New Jersey’s own laws, and by the state’s own data.
Environmental injustice means that some communities carry an unfair share of pollution and its health effects because of their race, income, or language, while others are protected from it. New Jersey is the most densely populated state in the country. It is home to refineries, ports, highways, power plants, incinerators, and more Superfund sites on EPA’s National Priorities List than any other state (U.S. EPA, n.d.). Where all of that is located, and who lives next to it, is not random.
Evidence 1: Research has shown it for decades
In 1987, the United Church of Christ published Toxic Wastes and Race in the United States, one of the first national studies of where hazardous waste facilities are located. It found that race was the strongest predictor of where these facilities were sited (Commission for Racial Justice, 1987). More recent research reaches similar conclusions. A 2021 study in Science Advances found that fine-particle air pollution (PM2.5) from most types of sources disproportionately and systemically affects people of color in the United States (Tessum et al., 2021).
Evidence 2: New Jersey’s own law says so
In September 2020, New Jersey passed what supporters called the strongest environmental justice law in the country. In the law itself, the Legislature officially declared (New Jersey Legislature, 2020):
“historically, New Jersey’s low-income communities and communities of color have been subject to a disproportionately high number of environmental and public health stressors, including pollution from numerous industrial, commercial, and governmental facilities located in those communities; that, as a result, residents in the State’s overburdened communities have suffered from increased adverse health effects including, but not limited to, asthma, cancer, elevated blood lead levels, cardiovascular disease, and developmental disorders”
The Legislature called this a “historical injustice” and said “it is past time for the State to correct” it. Under the law, certain polluting facilities, such as power plants, incinerators, large sewage plants, landfills, and scrap yards, must go through extra review before they can be built or expanded in an “overburdened community,” and in some cases the state must deny the permit.
Evidence 3: Who lives in overburdened communities
The law defines an overburdened community (OBC) as any census block group, a neighborhood of usually 600 to 3,000 people, where at least 35% of households are low-income, at least 40% of residents are people of color (or members of a state-recognized tribal community), or at least 40% of households have limited English proficiency. NJDEP adopted rules to carry out the law in April 2023 (N.J.A.C. 7:1C). Industry and labor groups appealed those rules in June 2023 (NJBIA, 2023); as of October 2023, the court had not ruled.
Using NJDEP’s official list (NJDEP, 2023):
- 3,459 of New Jersey’s 6,602 block groups (52.4%) are overburdened communities, home to about 5.0 million people (54% of the state).
- Most qualify through the minority test (3,243), many through the low-income test (1,445), and some through the limited-English test (141).
- The share of residents living in an OBC ranges from 90% in Hudson County and 80% in Essex to 7% in Hunterdon and 6% in Sussex.
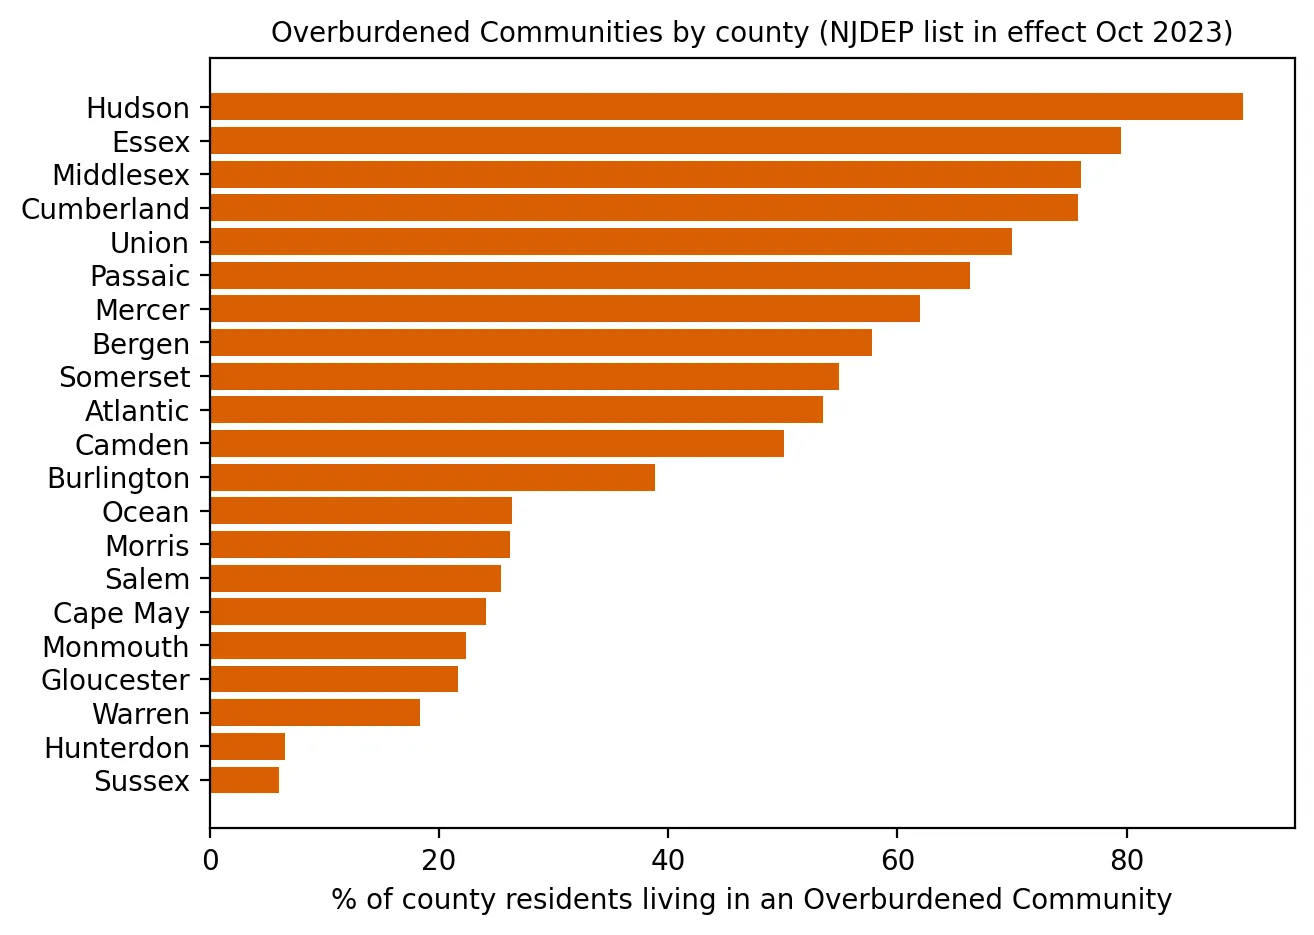 Figure 1. The share of residents living in an overburdened community varies widely by county, from 90% in Hudson to 6% in Sussex.
Evidence 4: The state’s data show the burden
NJDEP also measures more than two dozen environmental and public health “stressors” in every neighborhood, from air pollution to contaminated sites to missing tree cover. I compared overburdened communities with every other populated neighborhood in the state. For each stressor, I found the statewide middle value (the median) and counted how often each group is above it. If pollution were shared equally, both groups would be above the median about equally often.
They aren’t:
| Stressor | Overburdened communities above the state median | Other neighborhoods above the state median |
|---|---|---|
| Known contaminated sites | 72% | 25% |
| Air toxics cancer risk | 71% | 26% |
| Permitted air pollution sites | 71% | 26% |
| Pavement (impervious surface) | 71% | 27% |
| Lack of tree canopy | 70% | 27% |
| Diesel exhaust | 69% | 28% |
| Traffic | 66% | 32% |
| Older housing (lead paint risk) | 61% | 38% |
| Truck traffic | 58% | 41% |
| Scrap metal facilities | 45% | 19% |
| Solid waste facilities | 32% | 18% |
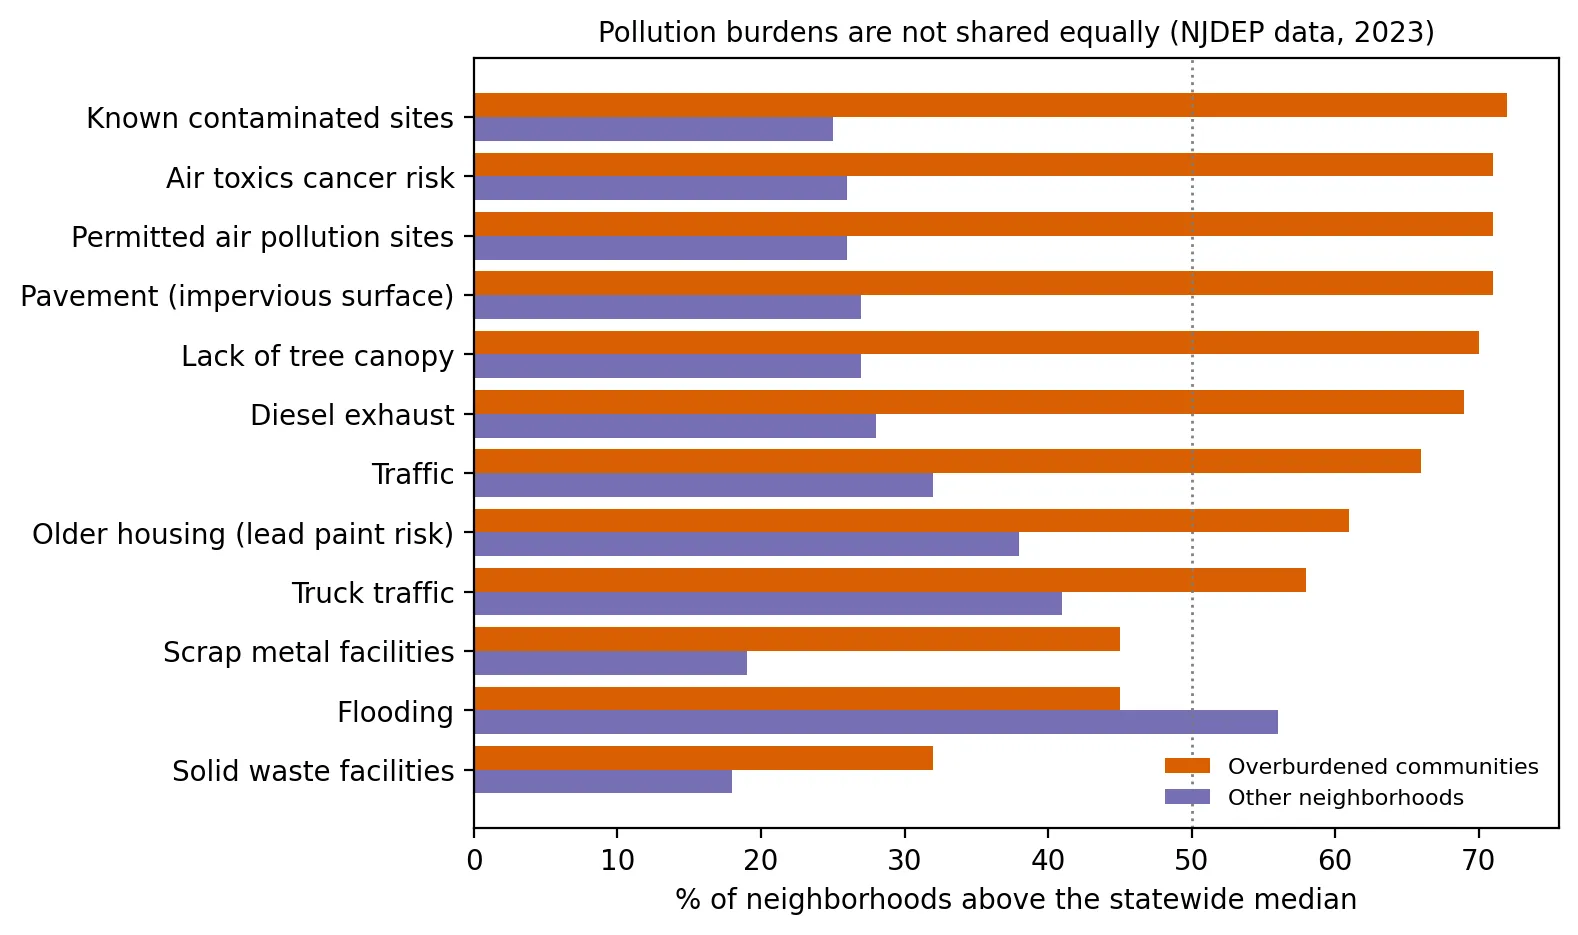 Figure 3. Overburdened communities are above the state median far more often than other neighborhoods on nearly every stressor, with flooding the exception.
Overburdened communities are almost three times as likely to be above the state median for contaminated sites, air toxics, permitted air pollution sites, and diesel exhaust. On average, they are above NJDEP’s comparison point on 16.8 stressors, compared with 12.6 for other neighborhoods. One exception is flooding, which is more common in other neighborhoods, largely because many shore towns are not overburdened communities. Every other stressor in the table falls more heavily on overburdened communities.
What this project will do
This project starts from a clear claim: environmental injustice exists in New Jersey. Each post will add evidence by looking closely at one form it takes:
- the air people breathe: smog, soot, toxic emissions, and smoke;
- the water they drink: lead, “forever chemicals,” and violations;
- heat, tree cover, and energy costs;
- toxic sites, polluting facilities, and the neighborhoods around them;
- flooding and climate risks; and
- how the state’s laws, courts, and agencies are responding.
Every post will use public data, include a small coding project in Python that anyone can rerun, and list its sources. Each post uses only information that was available on the date it was written. Some forms of injustice are sharper or more visible than others, and I’ll report exactly what the data show, because honest evidence is the strongest evidence.
Limitations
- The demographic data come from the Census Bureau’s American Community Survey, which is based on samples and has margins of error for small areas.
- Stressors measure exposure, not health outcomes. Living near a source of pollution raises risk, but it doesn’t tell us exactly who gets sick.
- The OBC list and stressor data are updated over time, so these numbers describe NJDEP’s data as of October 2023.
Code project (Level 0): counting and comparing
Goal: Use NJDEP’s official data to count overburdened communities and compare their pollution burdens with other neighborhoods.
Data: NJDEP, Environmental Justice (EJ) Law Combined Stressor Summary (version effective July 31, 2023 – January 30, 2024). The shared helper common/vintages.py downloads whichever version was in effect on a given date.
Steps:
- Load all 6,602 block groups.
- Mark a block group as an OBC if NJDEP lists any test it meets.
- Count OBCs and the people living in them, by test and by county.
- For each stressor, find the statewide median and compare the share of OBC and other neighborhoods above it.
- Make bar charts.
bg = load_ej(date(2023, 10, 2))                 # the version in effect on this post's date
v = bg["KCSL_BG"]                               # known contaminated sites
above = v > v.median()
print(above[bg.is_obc].mean(), above[~bg.is_obc].mean())
New skills: loading a dataset, filtering, counting, grouping, and comparing two groups.
Data and methods
Data sources
- NJDEP, *Environmental Justice (EJ) Law Combined Stressor Summary* (version effective July 31, 2023 – January 30, 2024). The shared helper common/vintages.py downloads whichever version was in effect on a given date.
The analysis was done in Python with public data. The full code, its data, and every figure it produces are in the code project below.
References
- Commission for Racial Justice, United Church of Christ. (1987). Toxic wastes and race in the United States. https://www.ucc.org/wp-content/uploads/2020/12/ToxicWastesRace.pdf
- New Jersey Business & Industry Association. (2023, June 13). Labor, business groups file appeals of NJ environmental justice rule. https://njbia.org/labor-business-groups-file-appeals-of-nj-environmental-justice-rule/
- New Jersey Department of Environmental Protection. (n.d.). Environmental justice law. https://dep.nj.gov/ej/law/
- New Jersey Department of Environmental Protection. (n.d.). Environmental justice rules (N.J.A.C. 7:1C). https://dep.nj.gov/ej/rules/
- New Jersey Department of Environmental Protection. (2023). Environmental Justice (EJ) Law Combined Stressor Summary for New Jersey (7-31-2023 to 1-30-2024) [Data set]. https://www.arcgis.com/home/item.html?id=cbfeefc67d2a4f71bdcc1eda9a629fa4
- New Jersey Legislature. (2020). P.L.2020, c.92: An act concerning the disproportionate environmental and public health impacts of pollution on overburdened communities. https://pub.njleg.gov/bills/2020/PL20/92_.PDF
- Tessum, C. W., Paolella, D. A., Chambliss, S. E., Apte, J. S., Hill, J. D., & Marshall, J. D. (2021). PM2.5 polluters disproportionately and systemically affect people of color in the United States. Science Advances, 7(18), eabf4491. https://doi.org/10.1126/sciadv.abf4491
- U.S. Environmental Protection Agency. (n.d.). Superfund: National Priorities List (NPL). https://www.epa.gov/superfund/superfund-national-priorities-list-npl