When It Rains, It Pours Sewage: Combined Sewer Overflows in New Jersey
Supports: When It Rains, It Pours Sewage: Combined Sewer Overflows in New Jersey
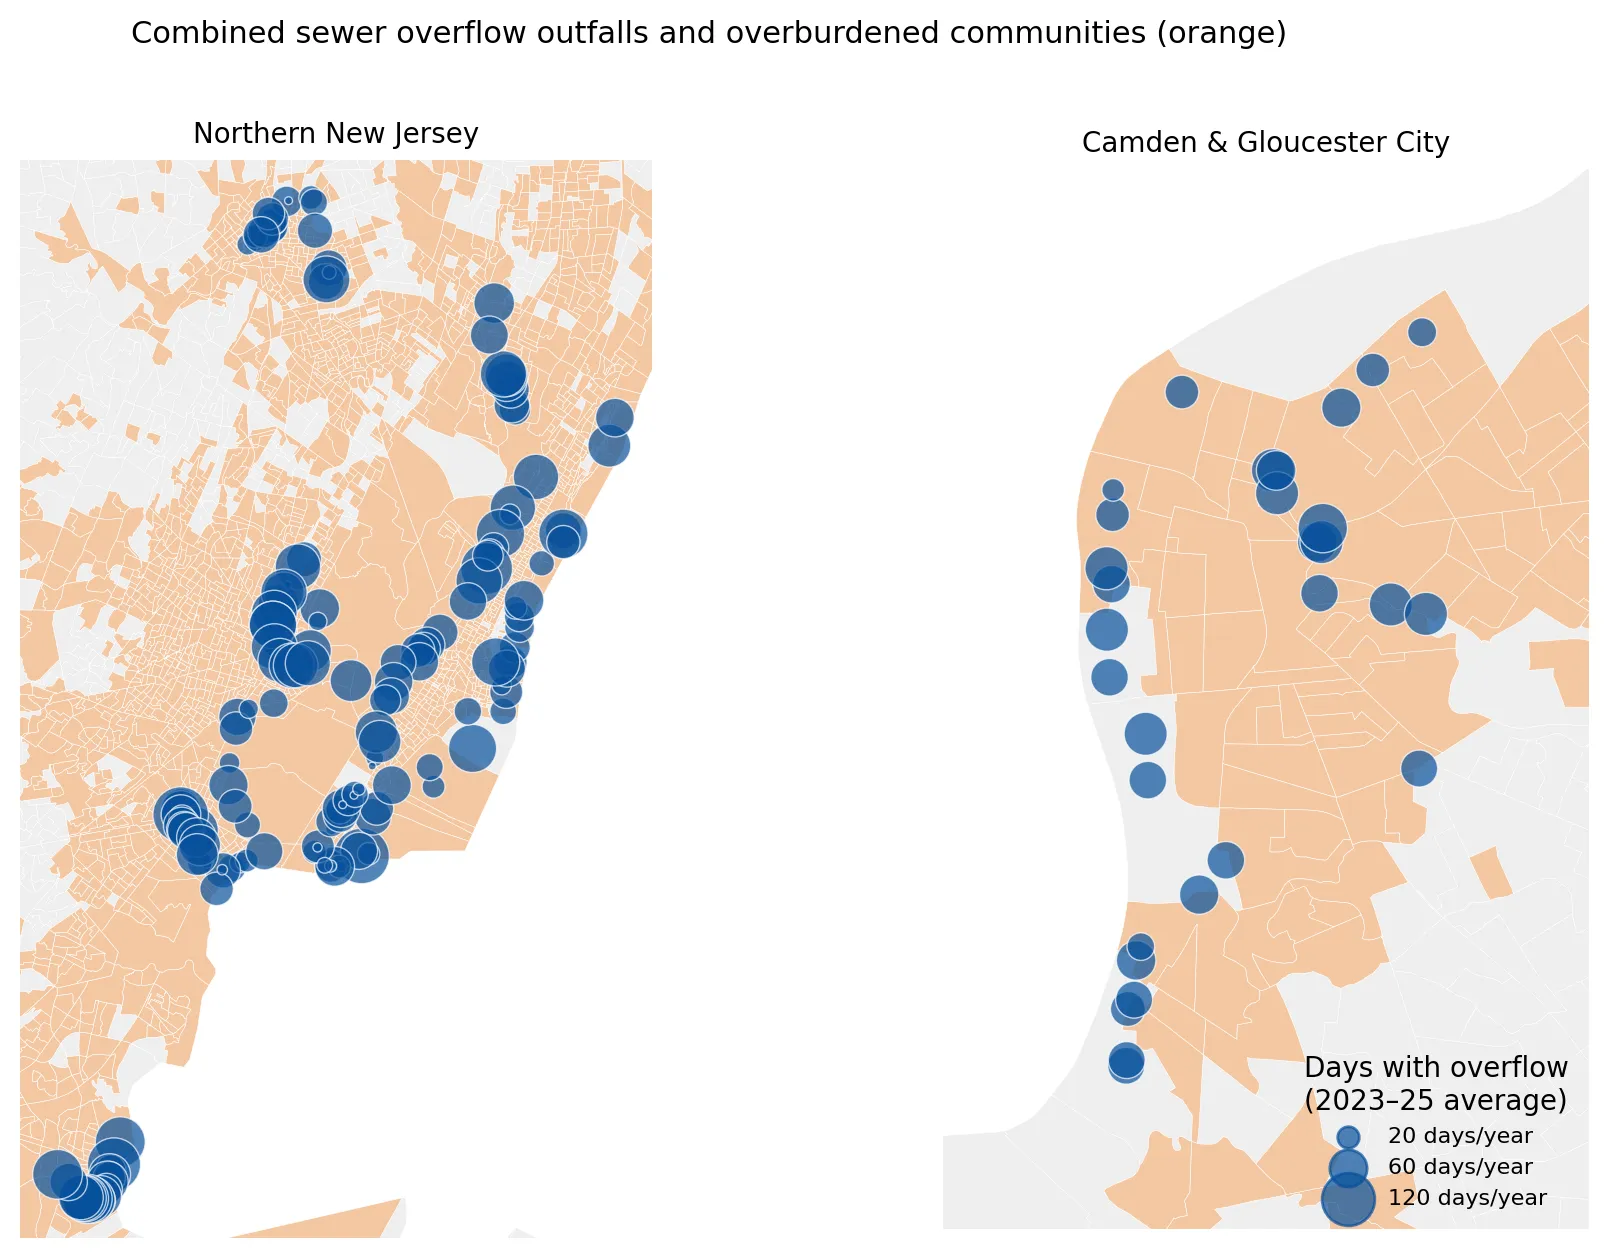
When it rains, old combined sewers overflow into New Jersey rivers. I looked at how often outfalls discharge and who lives nearby.
Produces: 3 figures
Folder: projects/2026-11-csos/
Mapped in 1937, Hotter in 2026: Redlining, Trees, and Heat in New Jersey
Supports: Mapped in 1937, Hotter in 2026: Redlining, Trees, and Heat in New Jersey
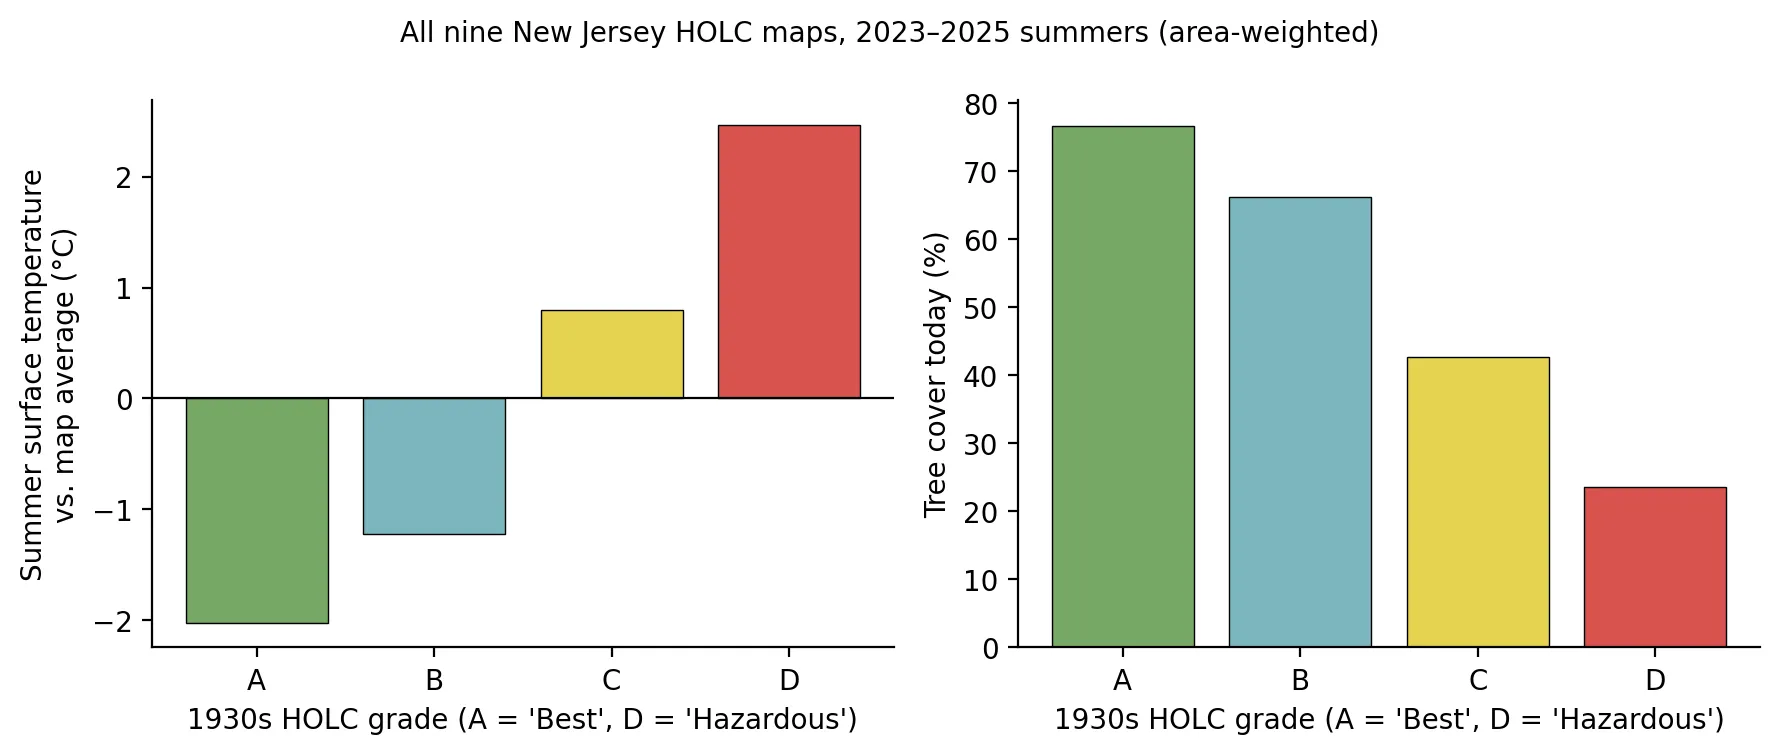
Neighborhoods redlined in the 1930s are hotter today, and tree cover explains most of the gap. Satellite heat and redlining in New Jersey.
Produces: 4 figures
Folder: projects/2026-11-heat-redlining/
A Power Plant for Every Square Mile? The Ironbound and the Hardest Case for Environmental Justice Law
Supports: A Power Plant for Every Square Mile? The Ironbound and the Hardest Case for Environmental Justice Law
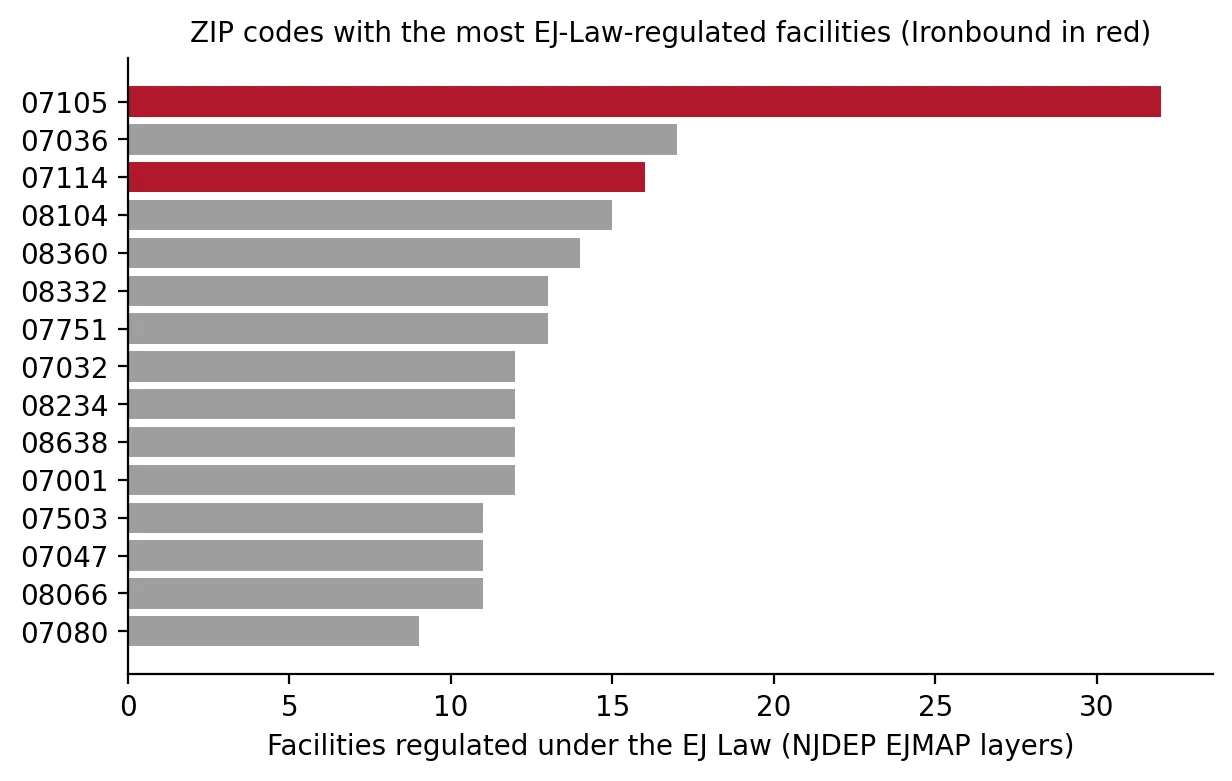
Does the Ironbound really host more environmental-justice-regulated facilities than anywhere in New Jersey? I tested the claim in the PVSC plant case.
Produces: 2 figures
Folder: projects/2026-11-ironbound/
Getting the Lead Out: Pipes, Paint, and Children's Blood in New Jersey
Supports: Getting the Lead Out: Pipes, Paint, and Children's Blood in New Jersey
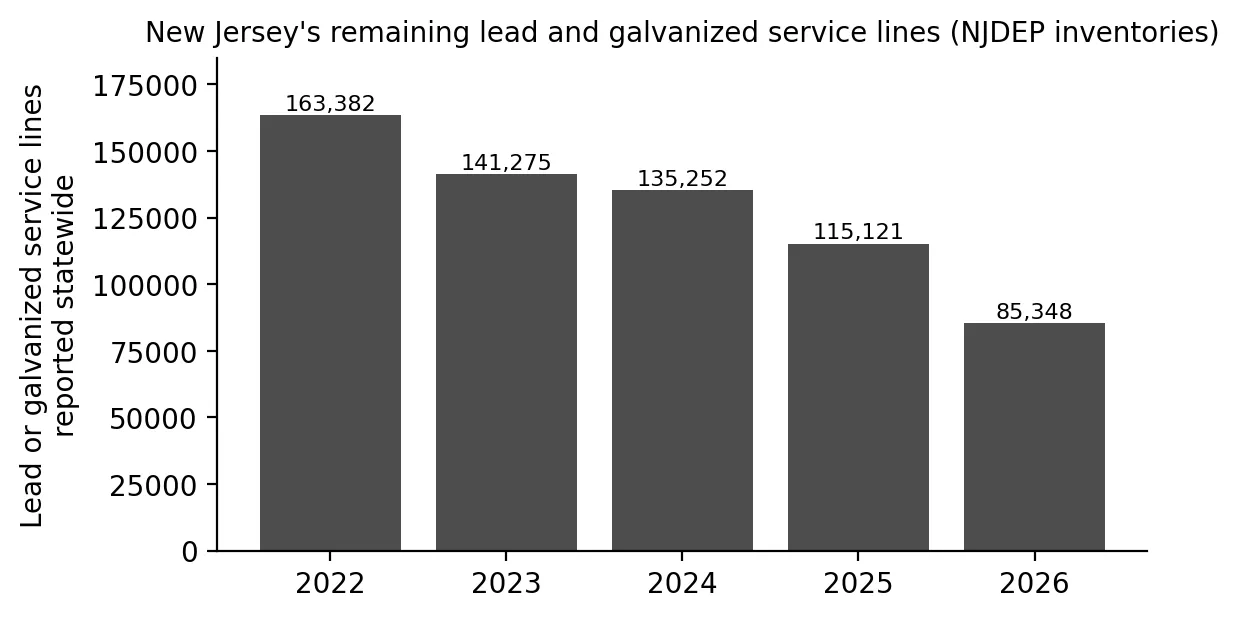
Lead pipes, old paint, and children's blood lead in New Jersey: where elevated levels are concentrated and what Newark and Trenton show about progress.
Produces: 3 figures
Folder: projects/2026-11-lead-lines/
Forever Chemicals, Everyone's Problem? PFAS in New Jersey's Drinking Water
Supports: Forever Chemicals, Everyone's Problem? PFAS in New Jersey's Drinking Water
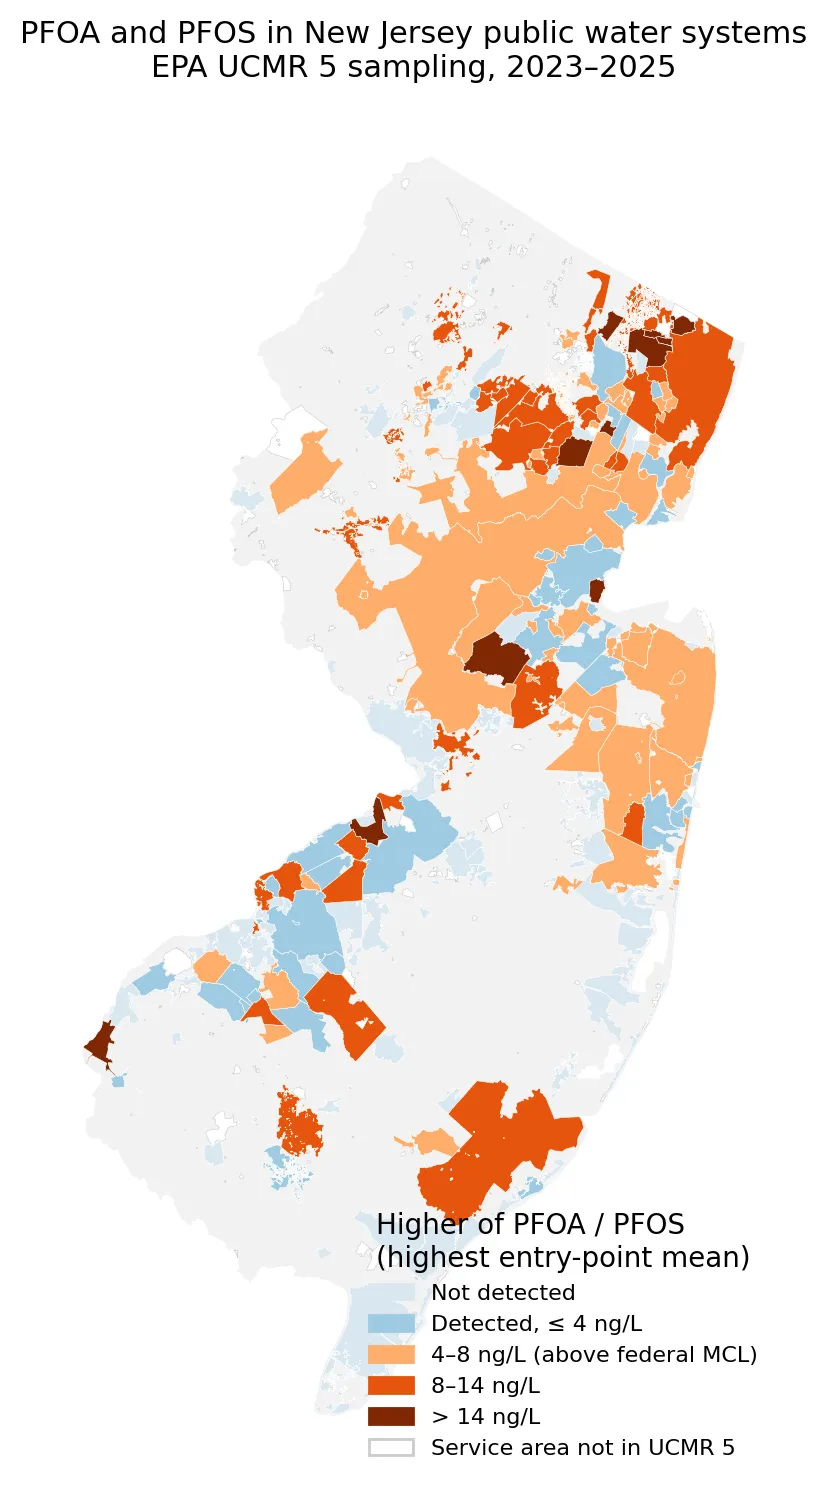
PFAS in New Jersey drinking water are widely shared across the state. A look at federal testing results, who is affected, and who pays for treatment.
Produces: 3 figures
Folder: projects/2026-11-pfas/
Toxic Tides: When Rising Seas Meet New Jersey's Contaminated Sites
Supports: Toxic Tides: When Rising Seas Meet New Jersey's Contaminated Sites
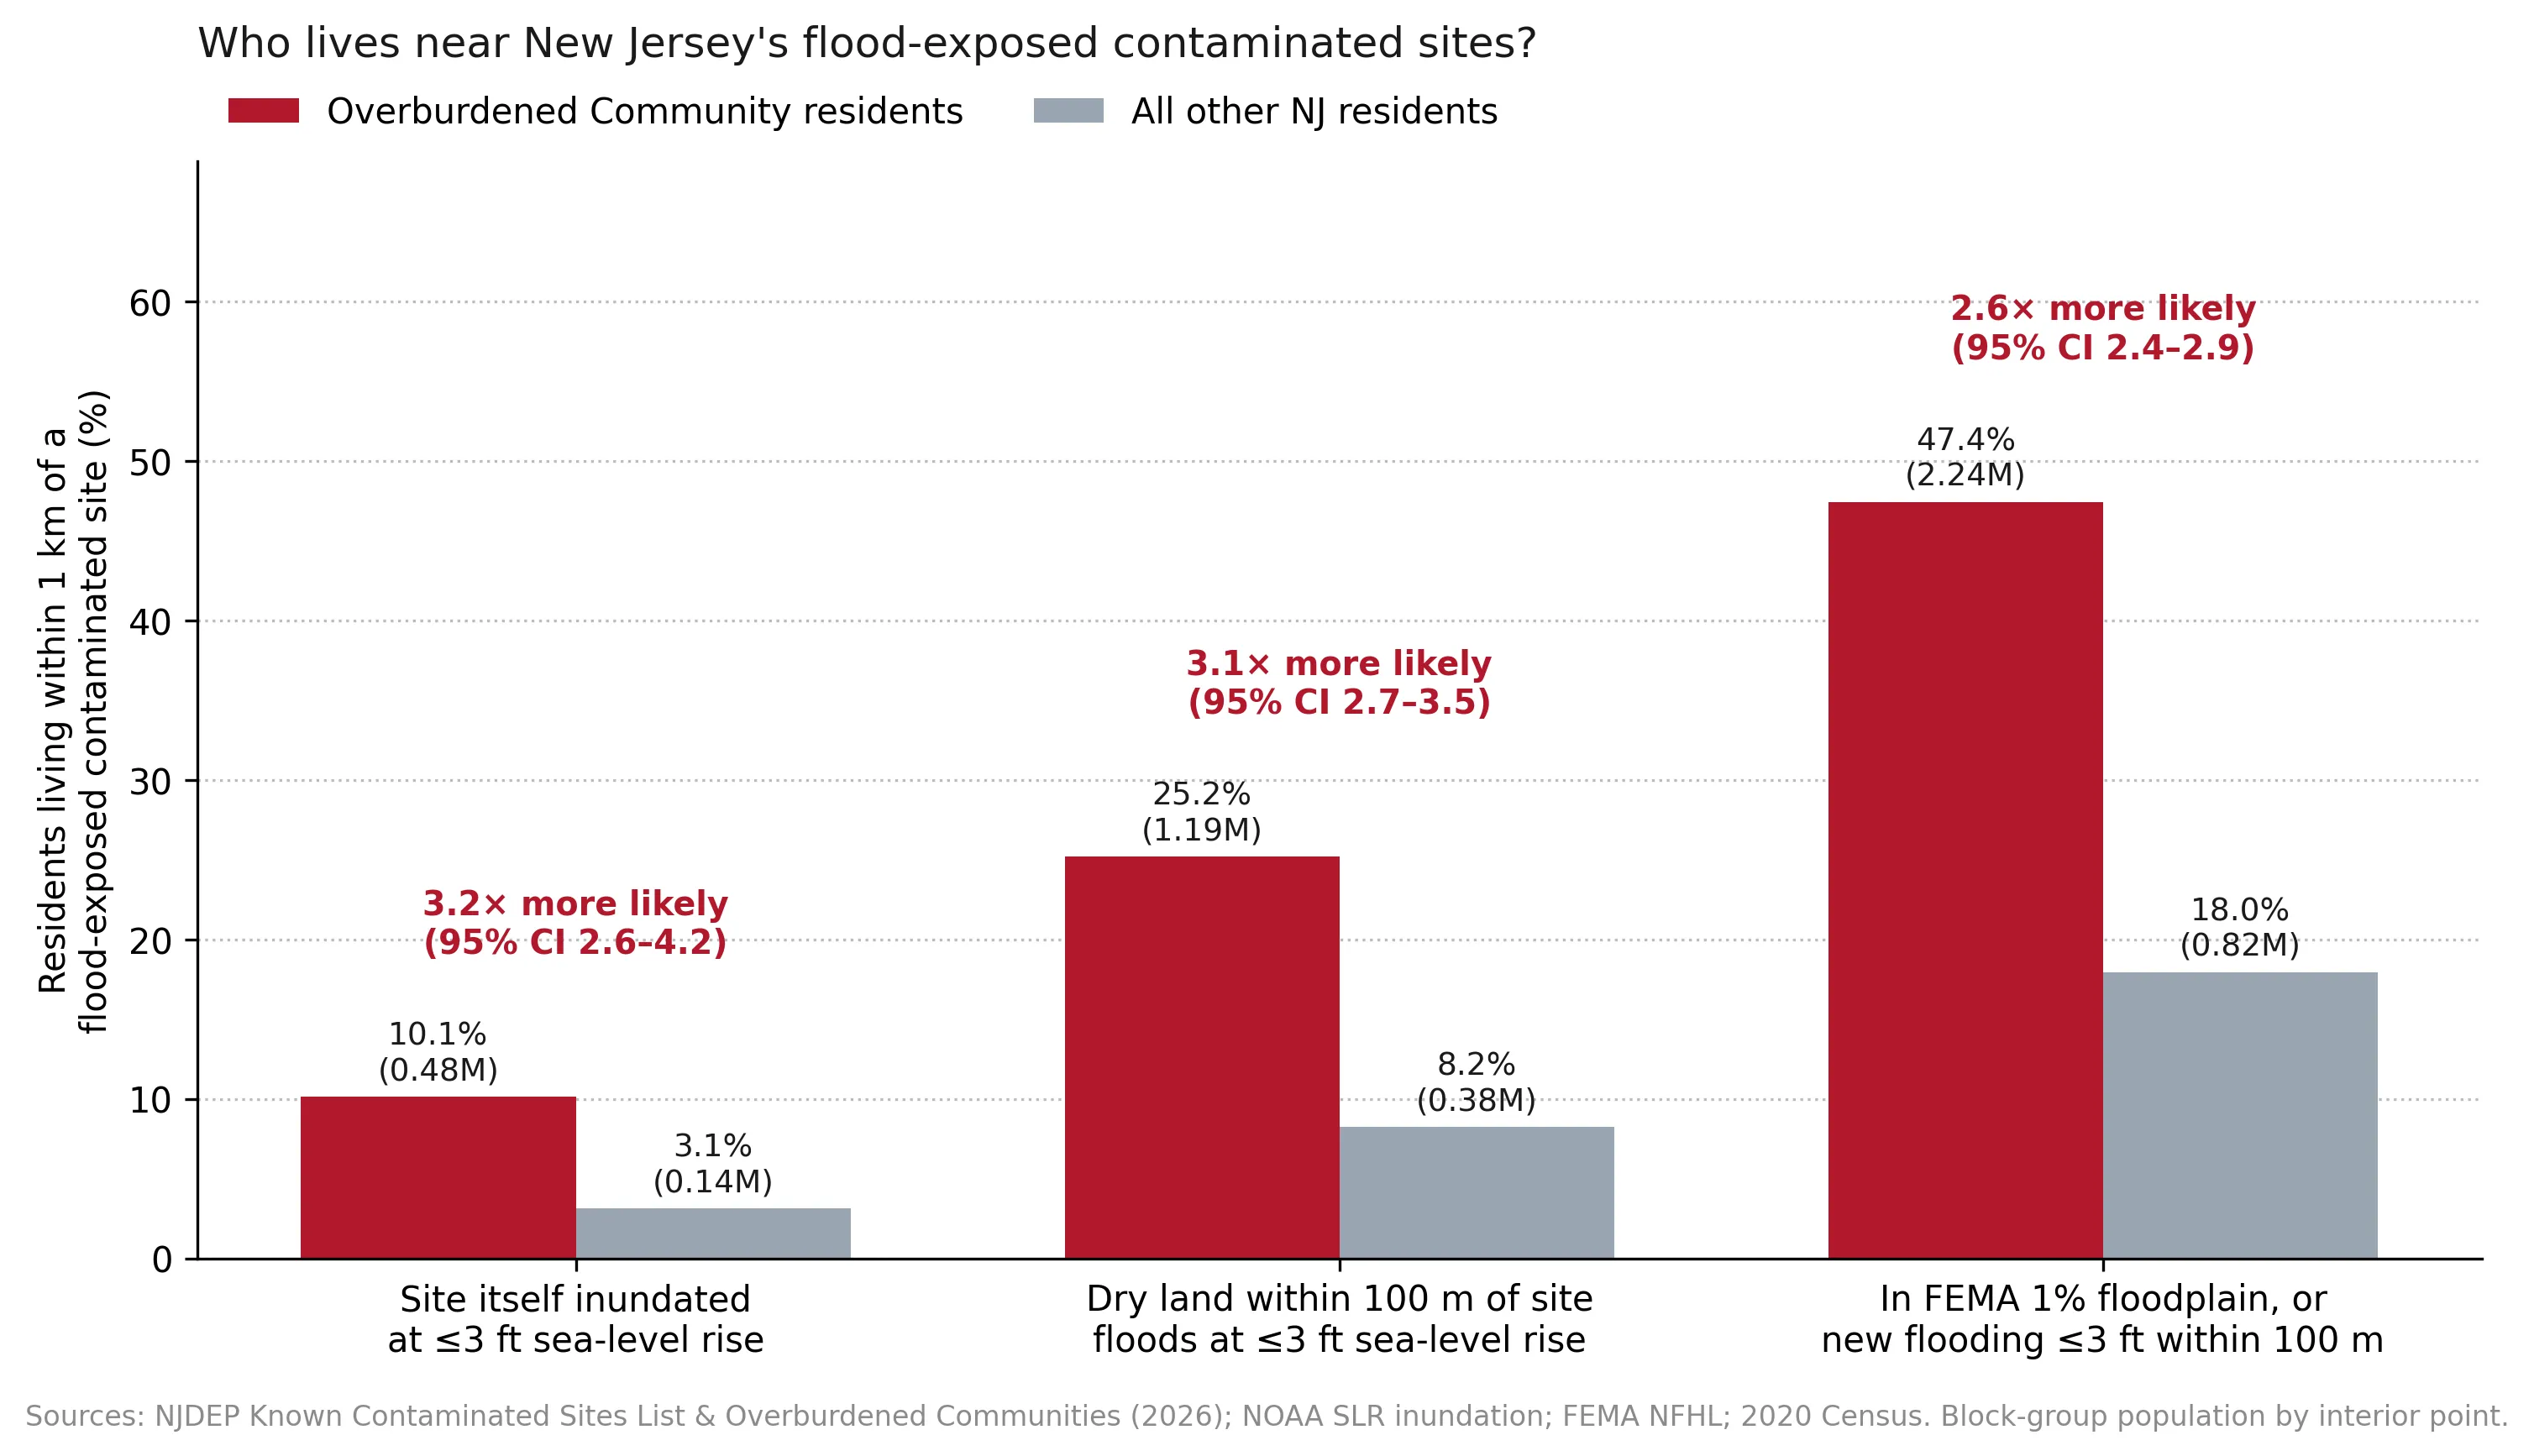
What happens when rising seas reach New Jersey's contaminated sites? I looked at which sites could flood and which communities live closest to them.
Produces: 5 figures
Folder: projects/2026-11-toxic-tides/
The Warehouse State: Diesel, Distribution, and a Gap in New Jersey's Environmental Justice Law
Supports: The Warehouse State: Diesel, Distribution, and a Gap in New Jersey's Environmental Justice Law
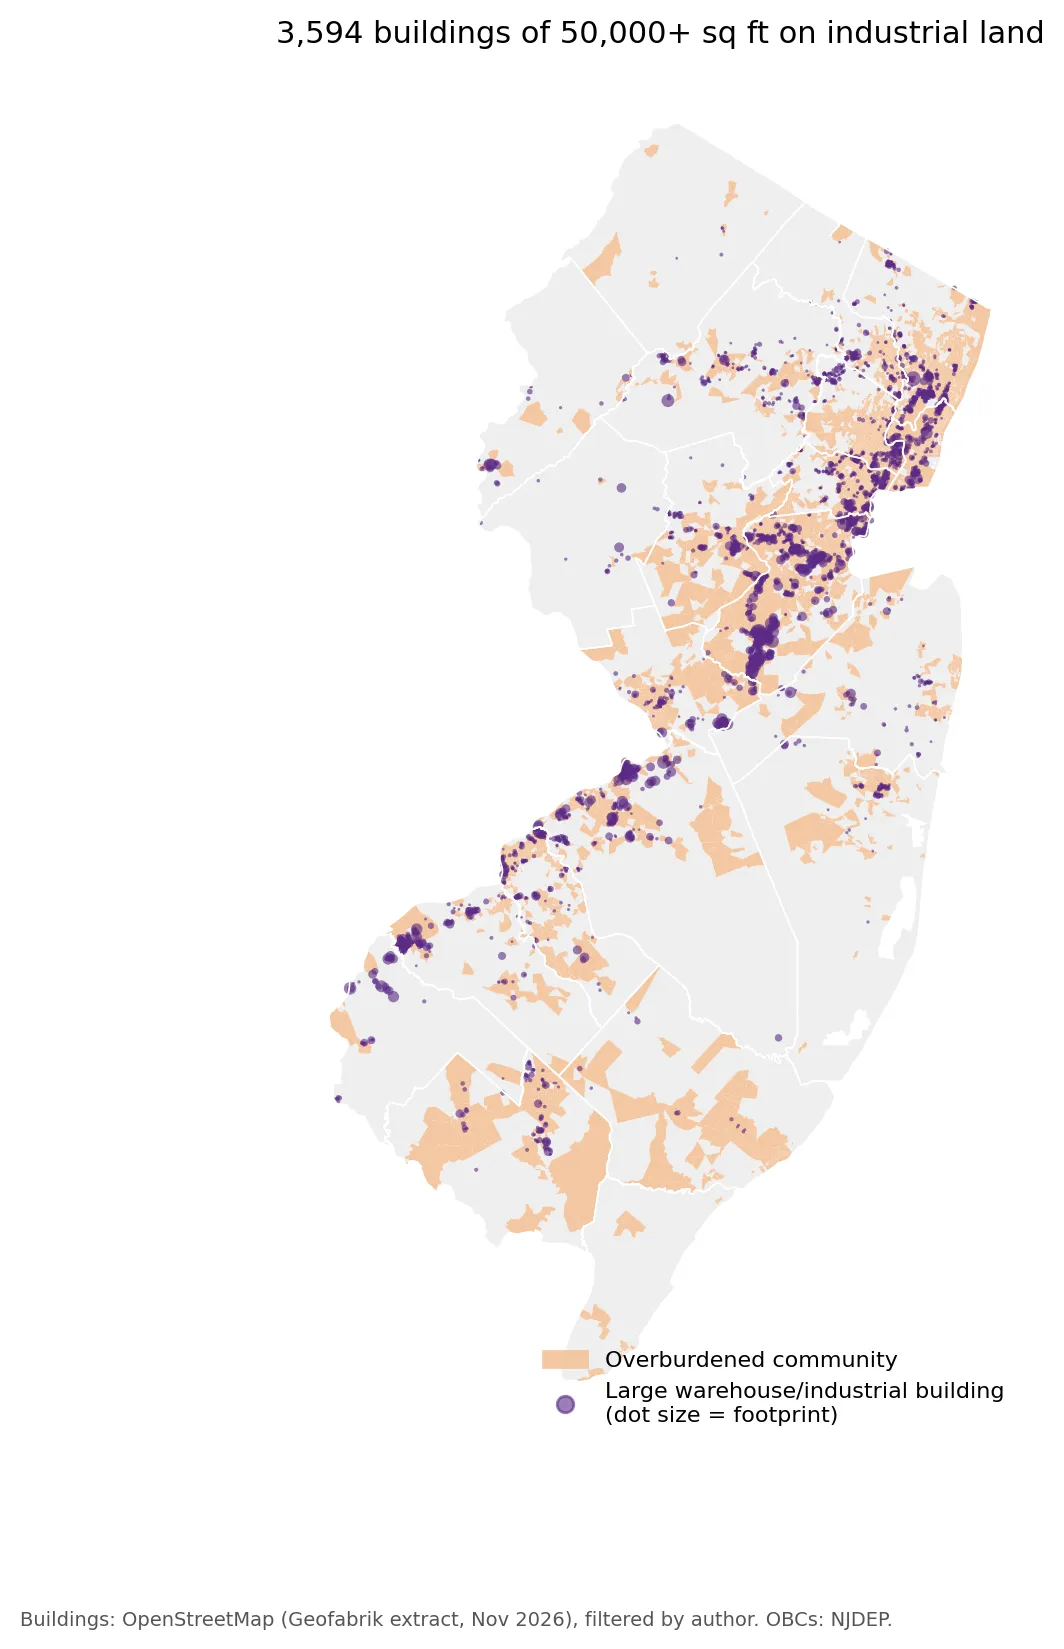
Diesel, distribution, and a gap in New Jersey's Environmental Justice Law: who lives near large warehouses, and what a proposed warehouse bill would cover.
Produces: 3 figures
Folder: projects/2026-11-warehouses/
Denial by Default? New Jersey's Environmental Justice Law Goes to the State Supreme Court
Supports: Denial by Default? New Jersey's Environmental Justice Law Goes to the State Supreme Court
How New Jersey's Environmental Justice Law works, what the courts have decided, and what the data show as the state Supreme Court reviews the rules.
Produces: 4 figures
Folder: projects/2026-11-ej-law-supreme-court/
Capstone: Building a Cumulative-Burden Index from the Data Up
Supports: Capstone: Building a Cumulative-Burden Index from the Data Up
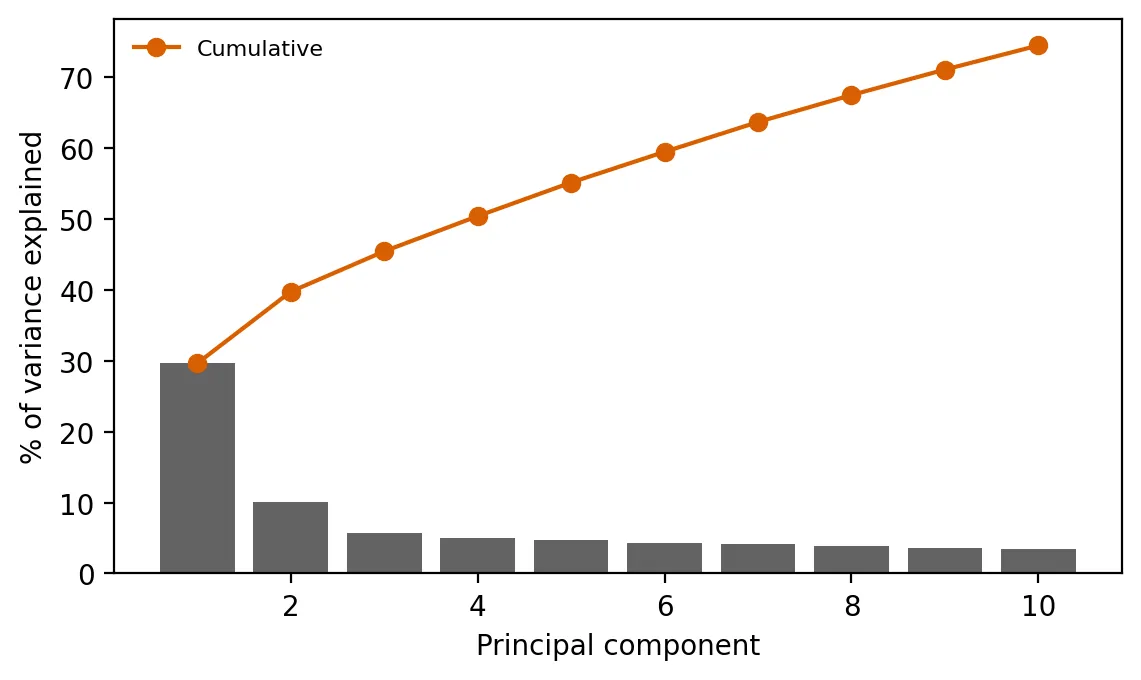
Build a data-driven cumulative-burden index, compare it with NJDEP's count-based approach, and identify community types.
Produces: 3 figures and 3 tables
Folder: projects/2026-10-capstone-pca/
Can Open Data Map New Jersey's Warehouses? A Lesson in Data Gaps and Spatial Bias
Supports: Can Open Data Map New Jersey's Warehouses? A Lesson in Data Gaps and Spatial Bias
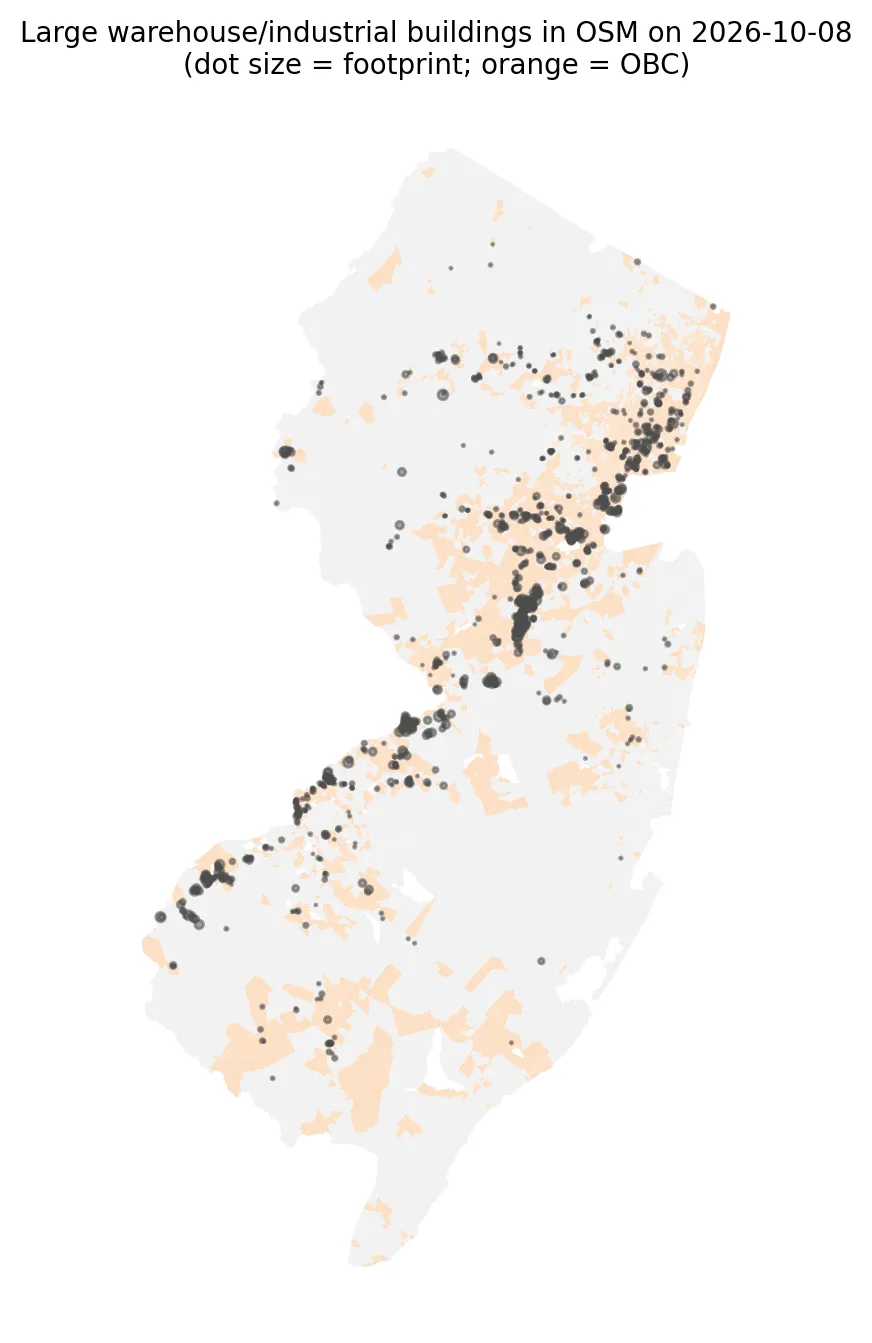
Build an as-of-date warehouse dataset from OpenStreetMap, check its completeness, and test whether warehouse exposure is associated with community characteristics after accounting for spatial dependence.
Produces: 2 figures and 2 tables
Folder: projects/2026-10-warehouses-osm/
Piling Up: How Many Serious Hazards Does Each Neighborhood Face at Once?
Supports: Piling Up: How Many Serious Hazards Does Each Neighborhood Face at Once?
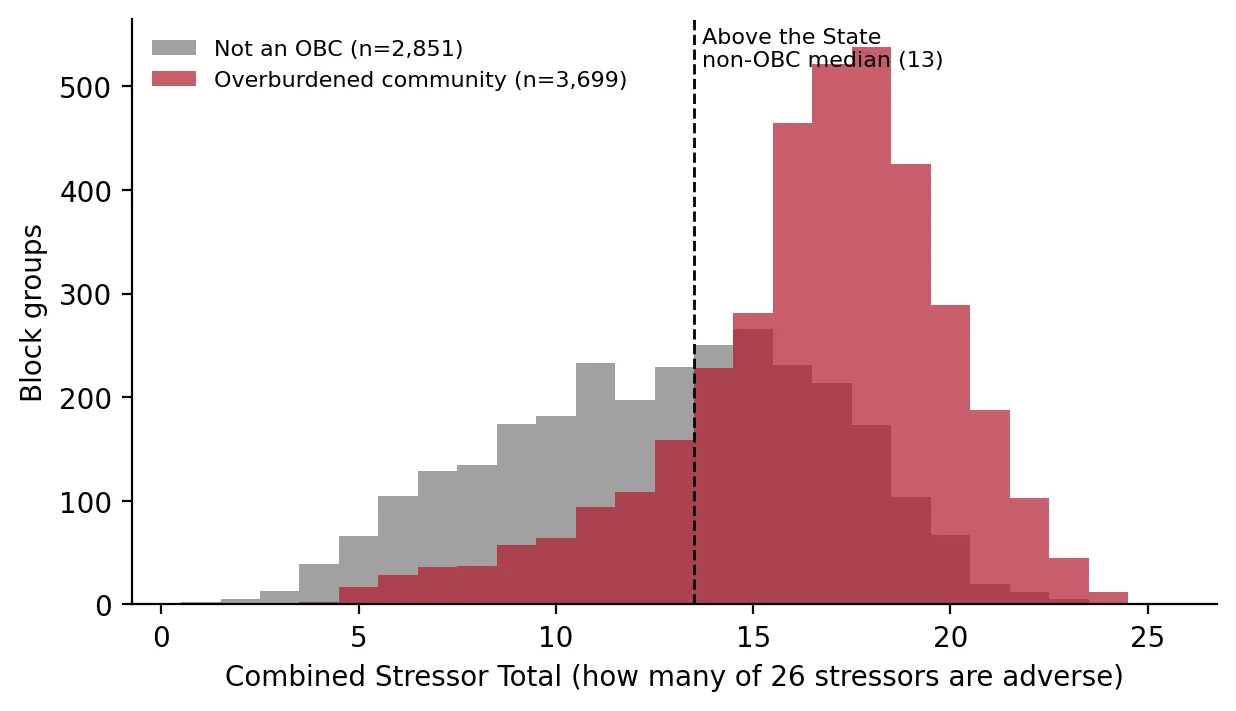
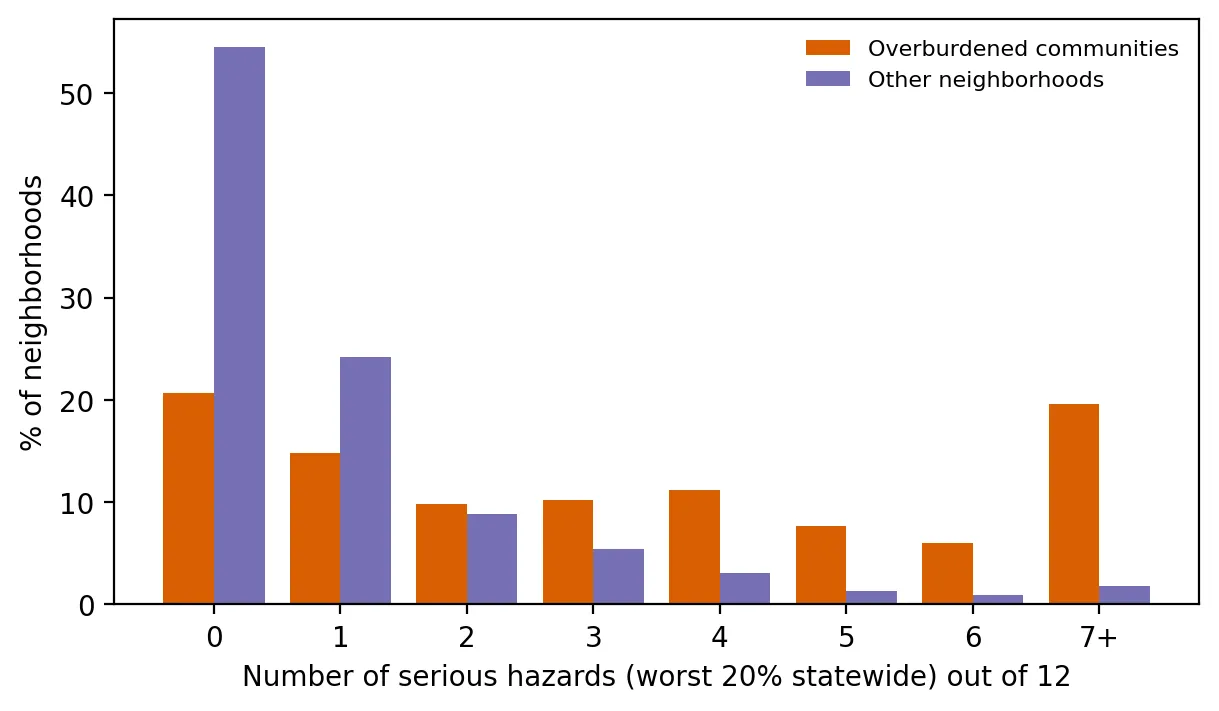
Count how many serious hazards each neighborhood faces and test whether overburdened communities face more, within the same county.
Produces: 2 figures and 1 table
Folder: projects/2026-09-cumulative-hazards/
The Supreme Court Takes the Case: Stress-Testing New Jersey's Stressor Test
Supports: The Supreme Court Takes the Case: Stress-Testing New Jersey's Stressor Test
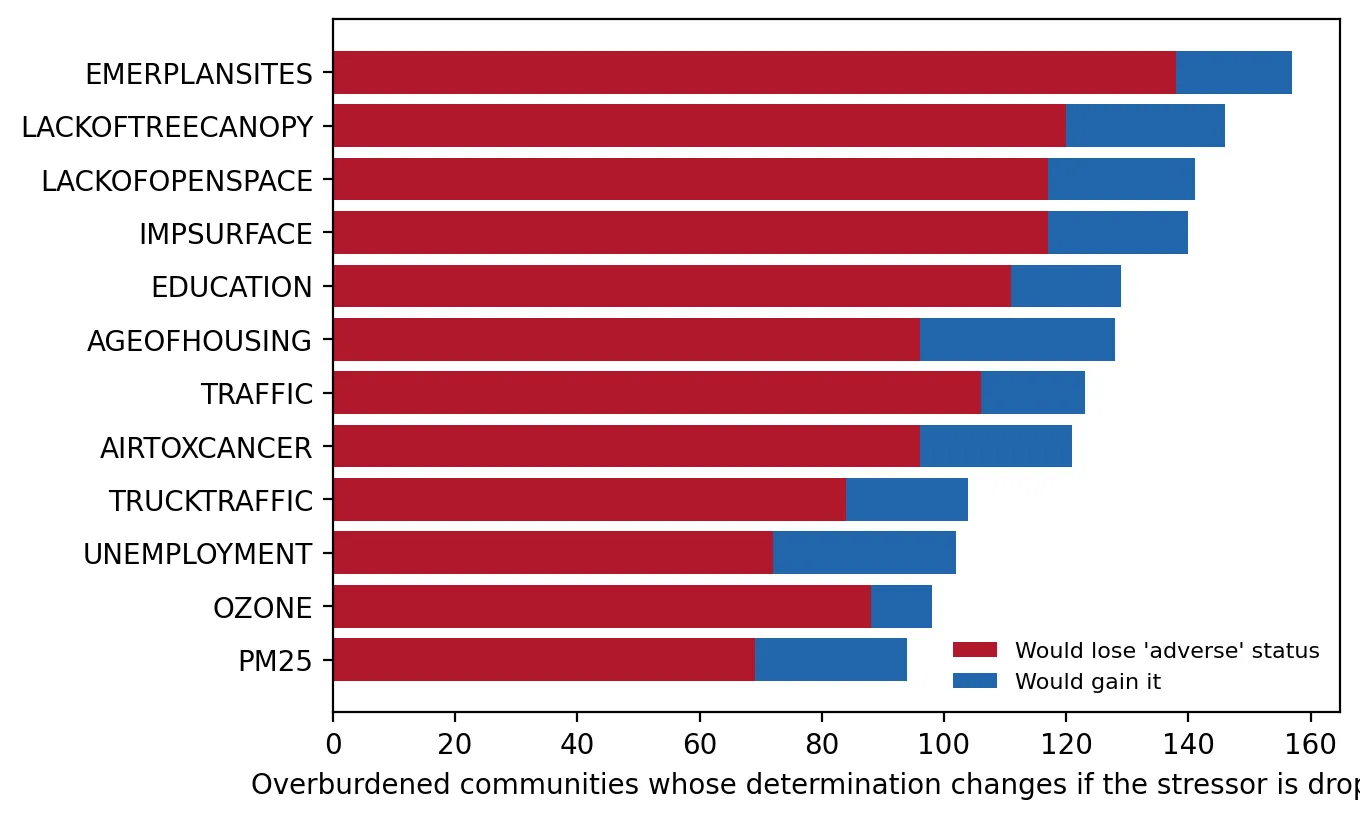
Test how sensitive NJDEP's "adverse cumulative stressors" determinations are to individual stressors and to measurement error.
Produces: 2 figures and 2 tables
Folder: projects/2026-09-supreme-court/
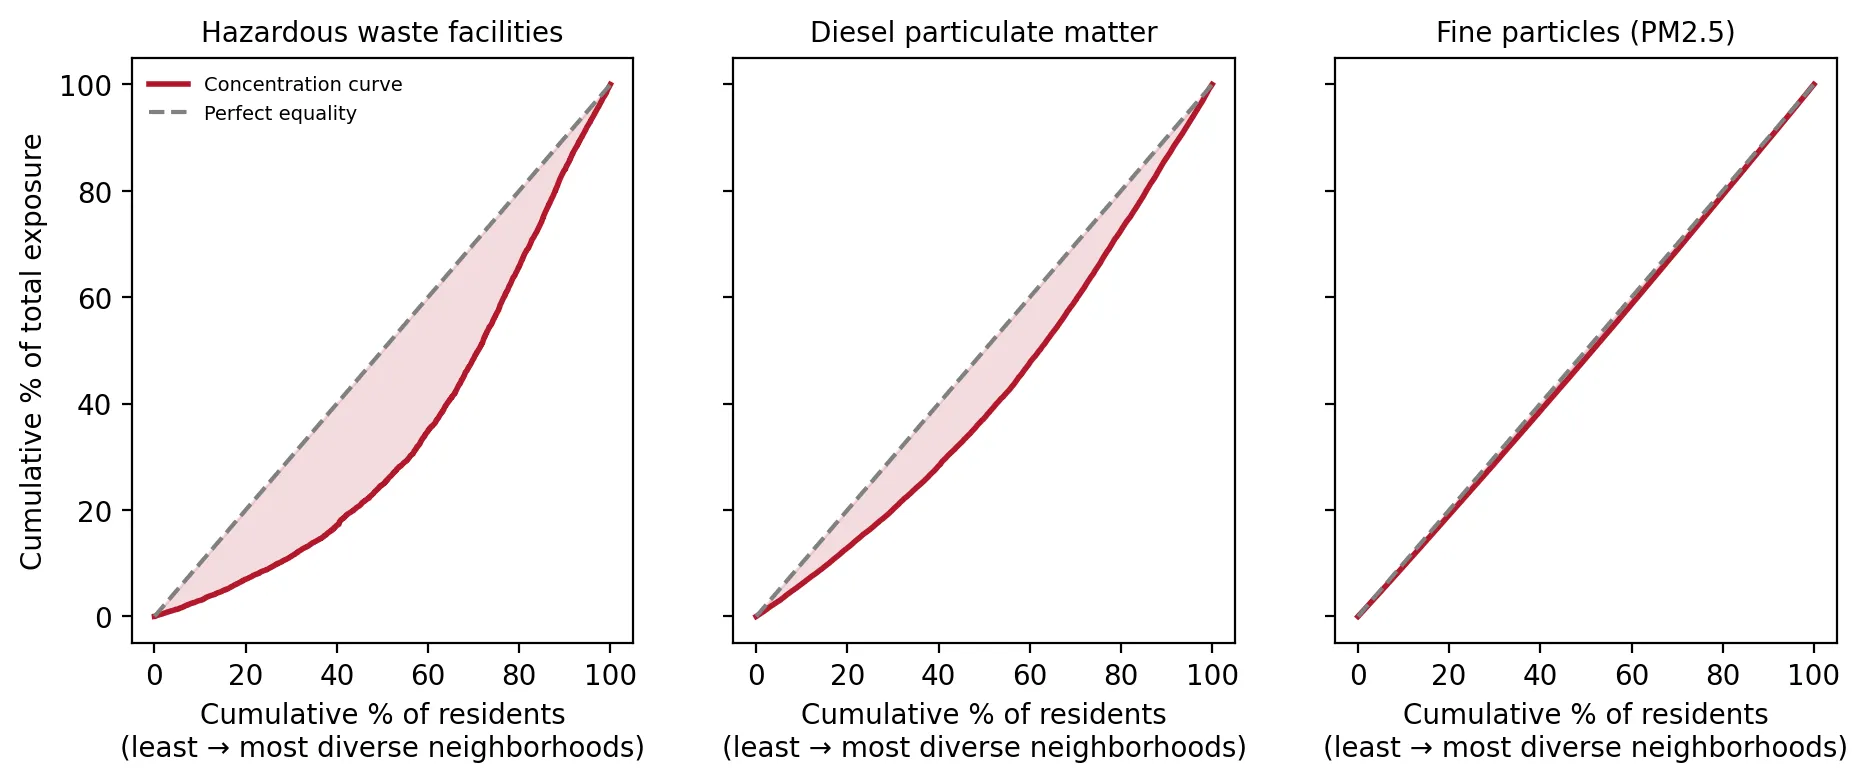
How Unequal Is It? Measuring New Jersey's Pollution Gap Like Economists Measure Income Inequality
Supports: How Unequal Is It? Measuring New Jersey's Pollution Gap Like Economists Measure Income Inequality
Measure how concentrated each environmental burden is among residents of more diverse and lower-income neighborhoods.
Produces: 2 figures and 1 table
Folder: projects/2026-08-how-unequal/
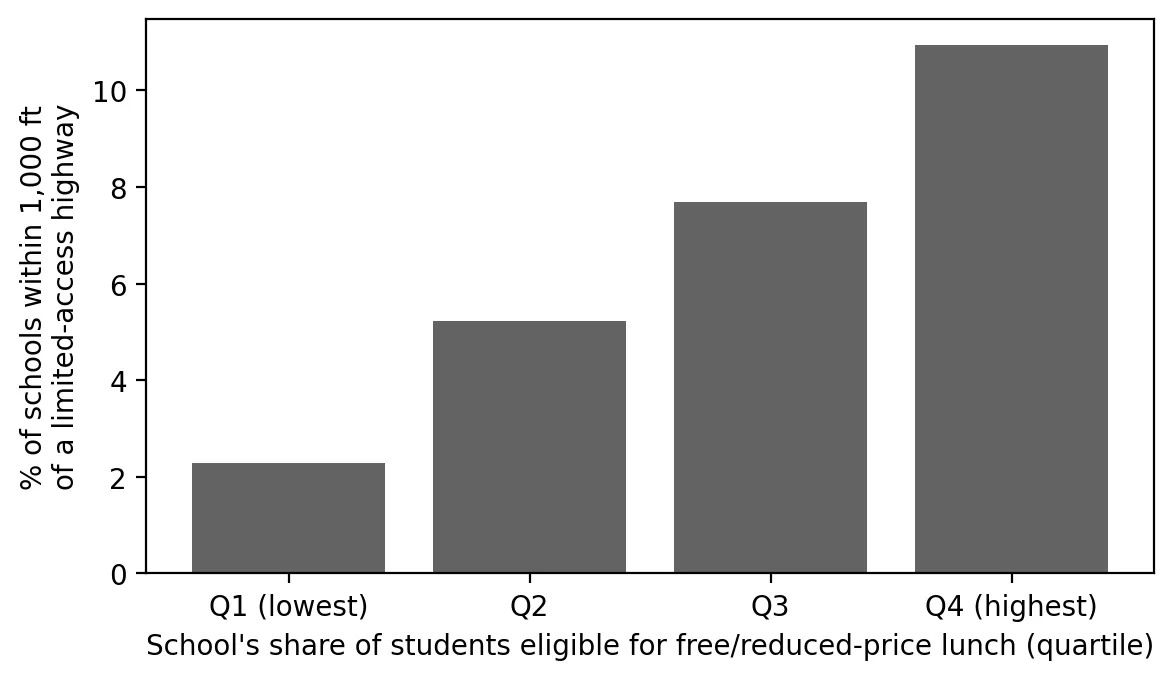
Back to School Next to the Highway
Supports: Back to School Next to the Highway
Measure how many New Jersey students attend school near limited-access highways and whether this differs by school poverty.
Produces: 2 figures and 1 table
Folder: projects/2026-08-schools-highways/
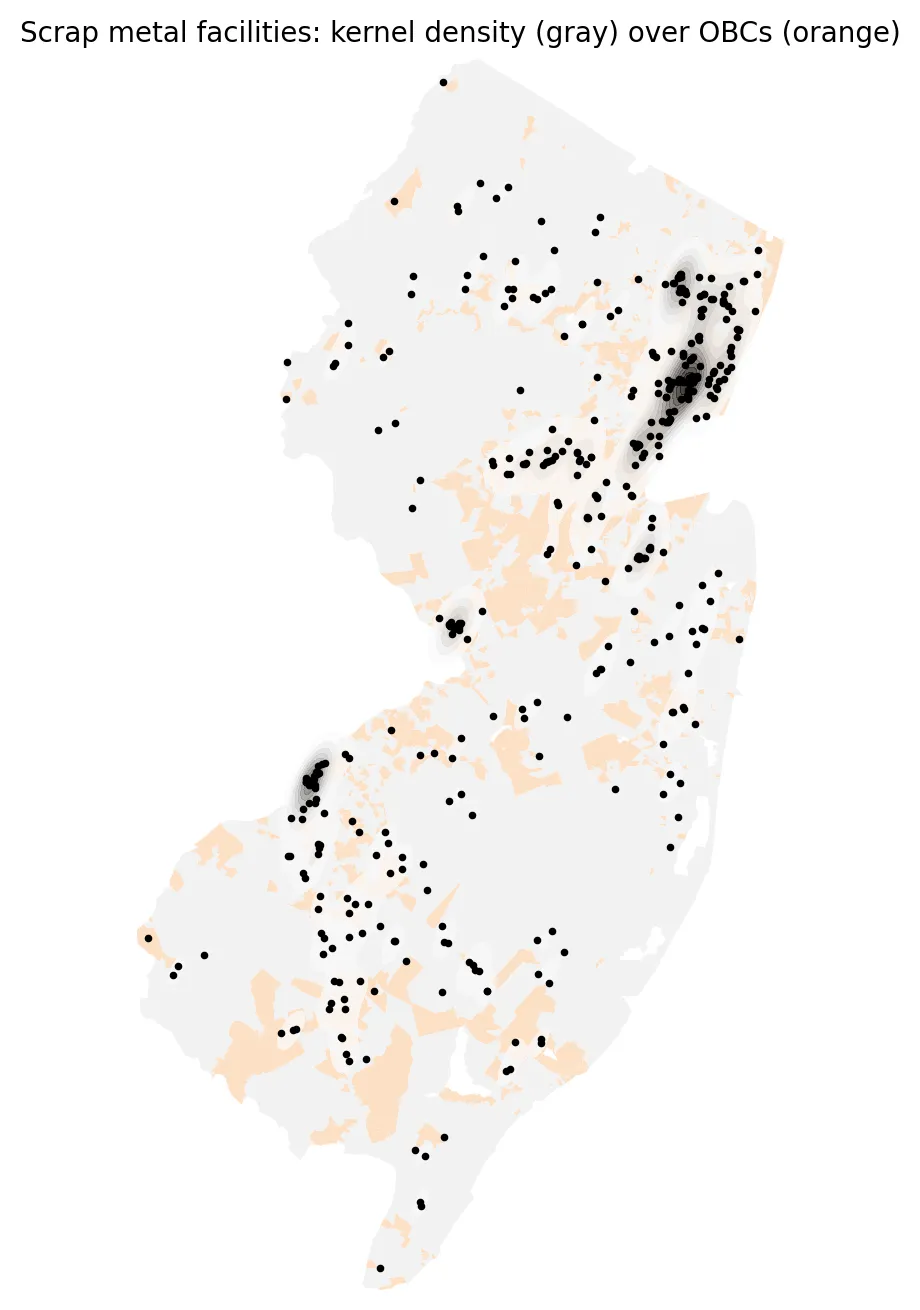
The Scrap Yard Next Door: Mapping New Jersey's Metal Recyclers
Supports: The Scrap Yard Next Door: Mapping New Jersey's Metal Recyclers
Map where scrap metal facilities cluster, and compare how close OBC and other residents live to them.
Produces: 2 figures
Folder: projects/2026-08-scrap-yards/
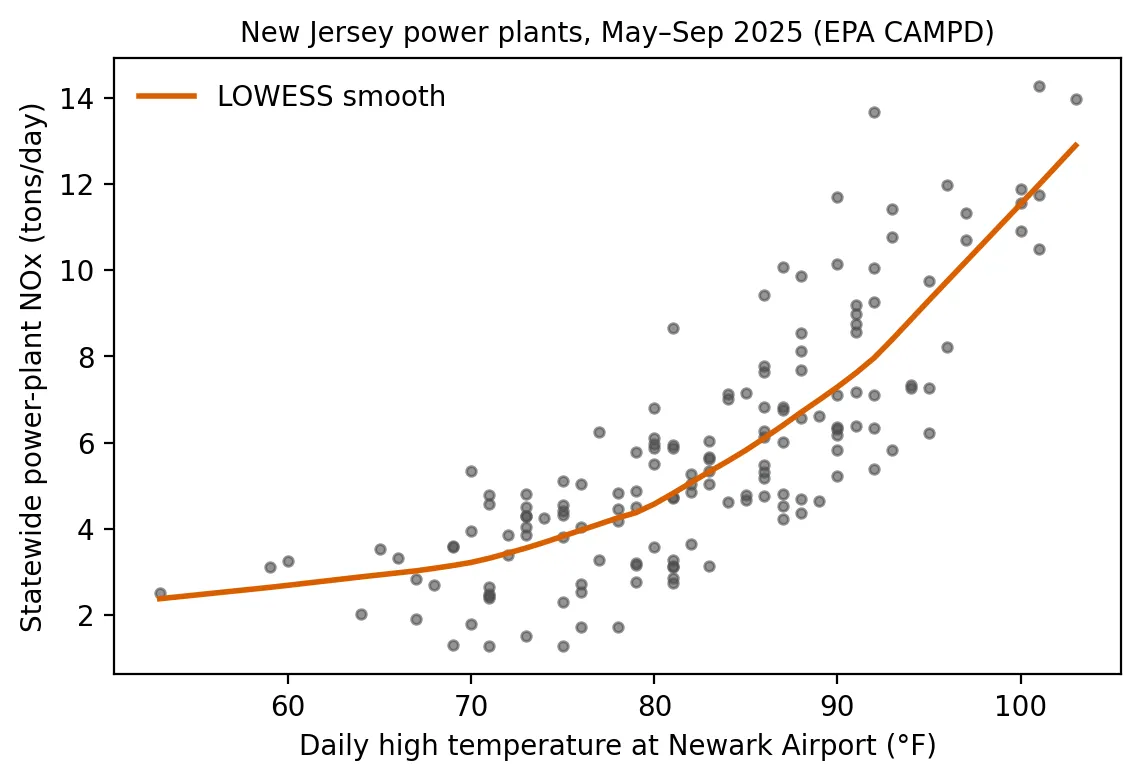
Peaker Plants on Hot Days: When the Heat Rises, So Does Power-Plant Pollution
Supports: Peaker Plants on Hot Days: When the Heat Rises, So Does Power-Plant Pollution
Measure how New Jersey power-plant NOx responds to hot days, and the role of peakers.
Produces: 2 figures and 2 tables
Folder: projects/2026-07-peakers-hot-days/
Did the Heat Grants Reach the Hottest Places?
Supports: Did the Heat Grants Reach the Hottest Places?
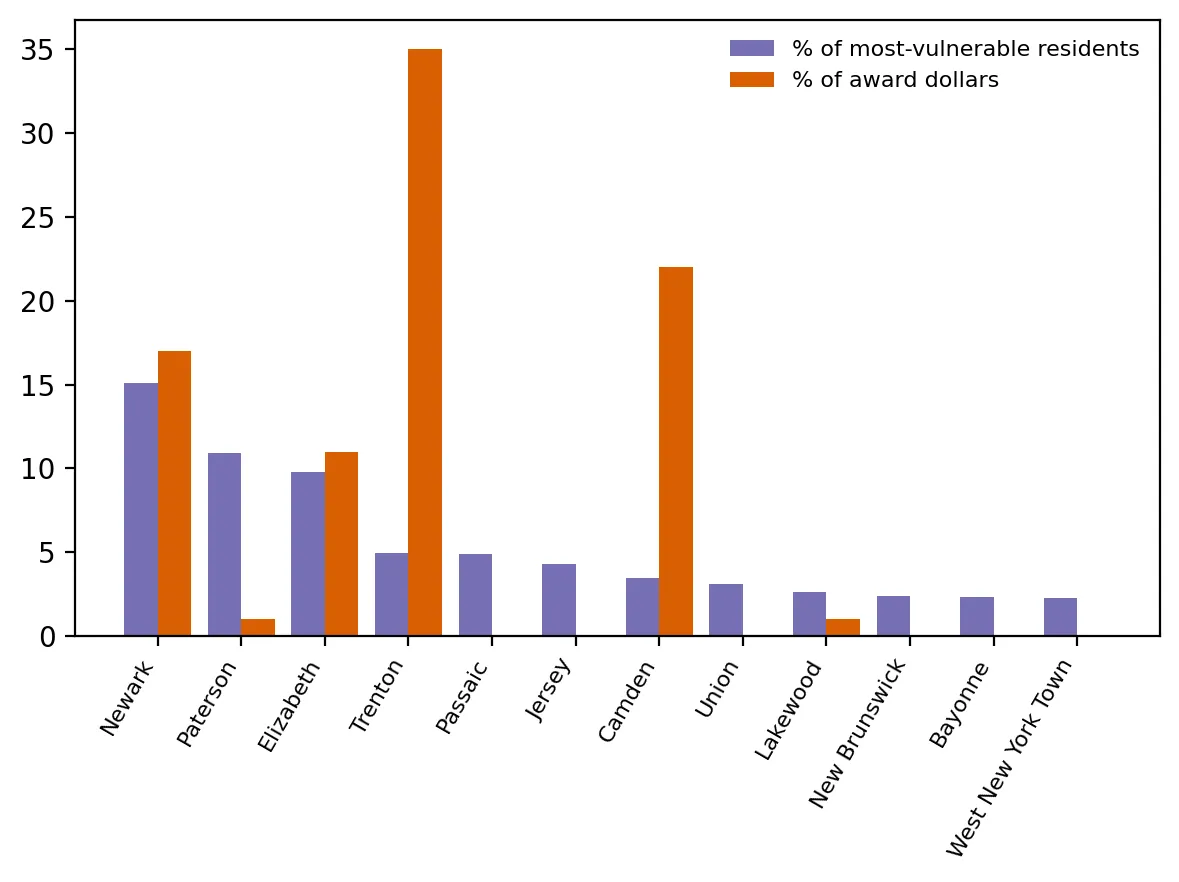
Compare where heat-island grant dollars went with where heat vulnerability is concentrated.
Produces: 2 figures and 1 table
Folder: projects/2026-07-heat-grants/
The July Heat Wave: Mapping New Jersey's Heat Hot Spots
Supports: The July Heat Wave: Mapping New Jersey's Heat Hot Spots
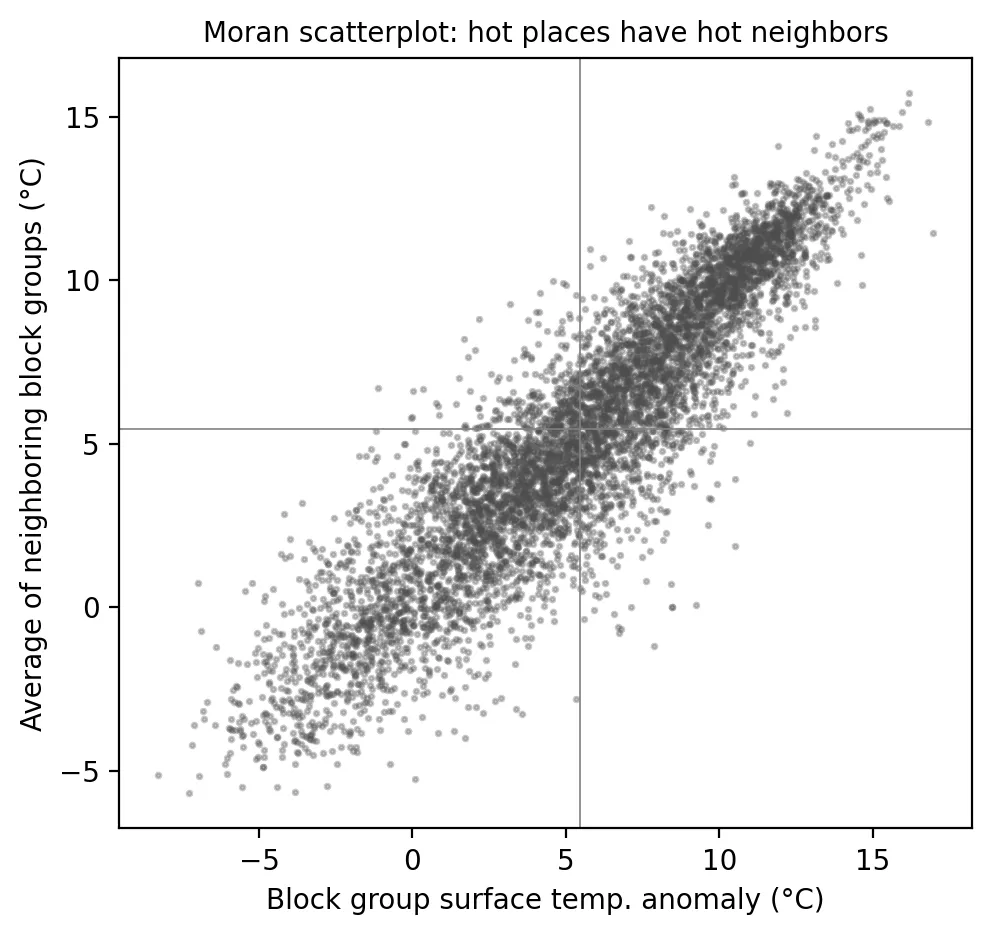
Test whether heat clusters spatially and identify statistically significant hot spots.
Produces: 2 figures and 2 tables
Folder: projects/2026-07-july-heat-wave/
Measuring Heat Vulnerability: Who Is Most at Risk When the Next Heat Wave Hits?
Supports: Measuring Heat Vulnerability: Who Is Most at Risk When the Next Heat Wave Hits?
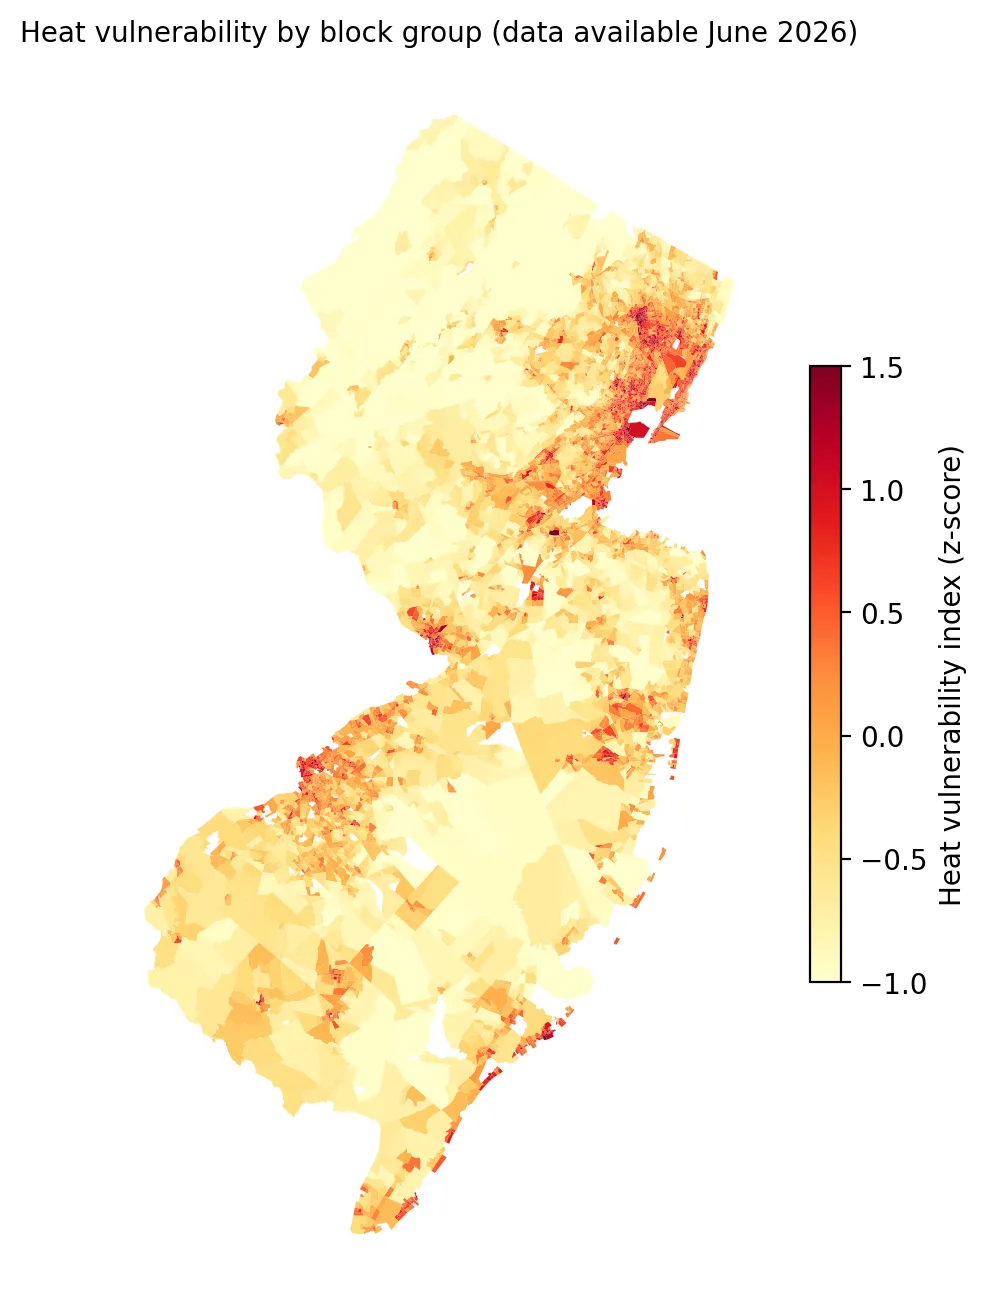
Build and test a block-group heat vulnerability index for New Jersey.
Produces: 2 figures and 1 table
Folder: projects/2026-06-heat-vulnerability/
One Bad Day: Who Lives Near New Jersey's High-Risk Chemical Facilities?
Supports: One Bad Day: Who Lives Near New Jersey's High-Risk Chemical Facilities?
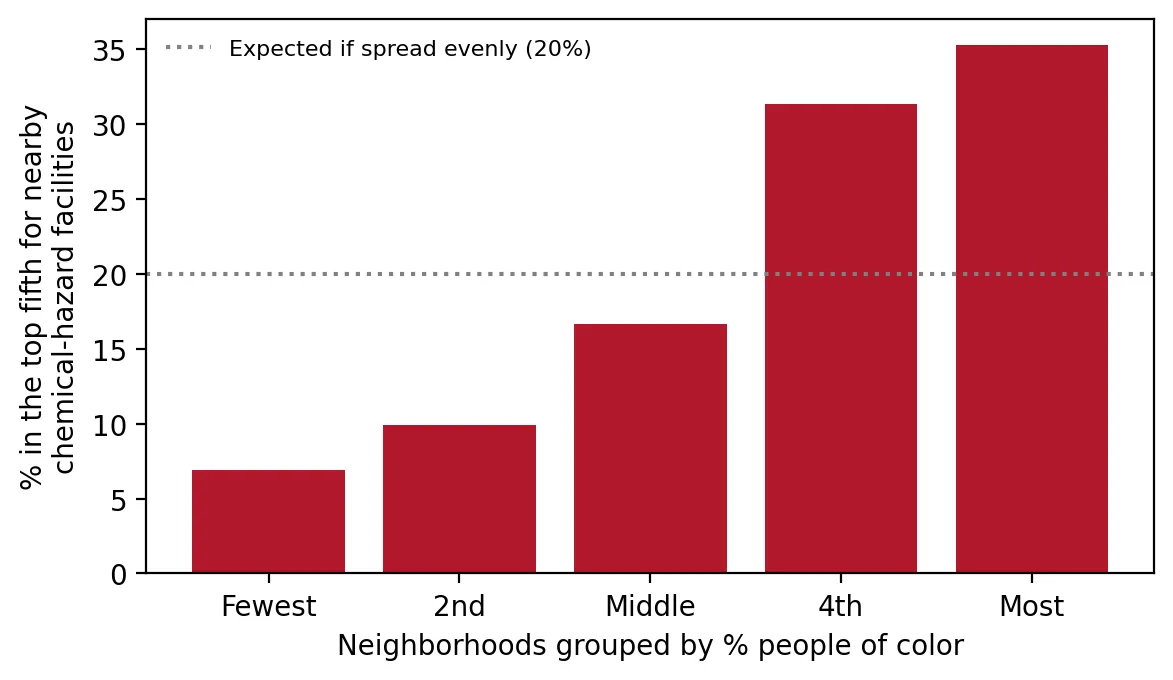
Test whether overburdened communities are more likely to be among New Jersey's most chemical-hazard-dense neighborhoods, and how confident we can be.
Produces: 2 figures and 1 table
Folder: projects/2026-06-chemical-risk/
A Decade of Ozone: New Jersey's Progress Has Stalled
Supports: A Decade of Ozone: New Jersey's Progress Has Stalled
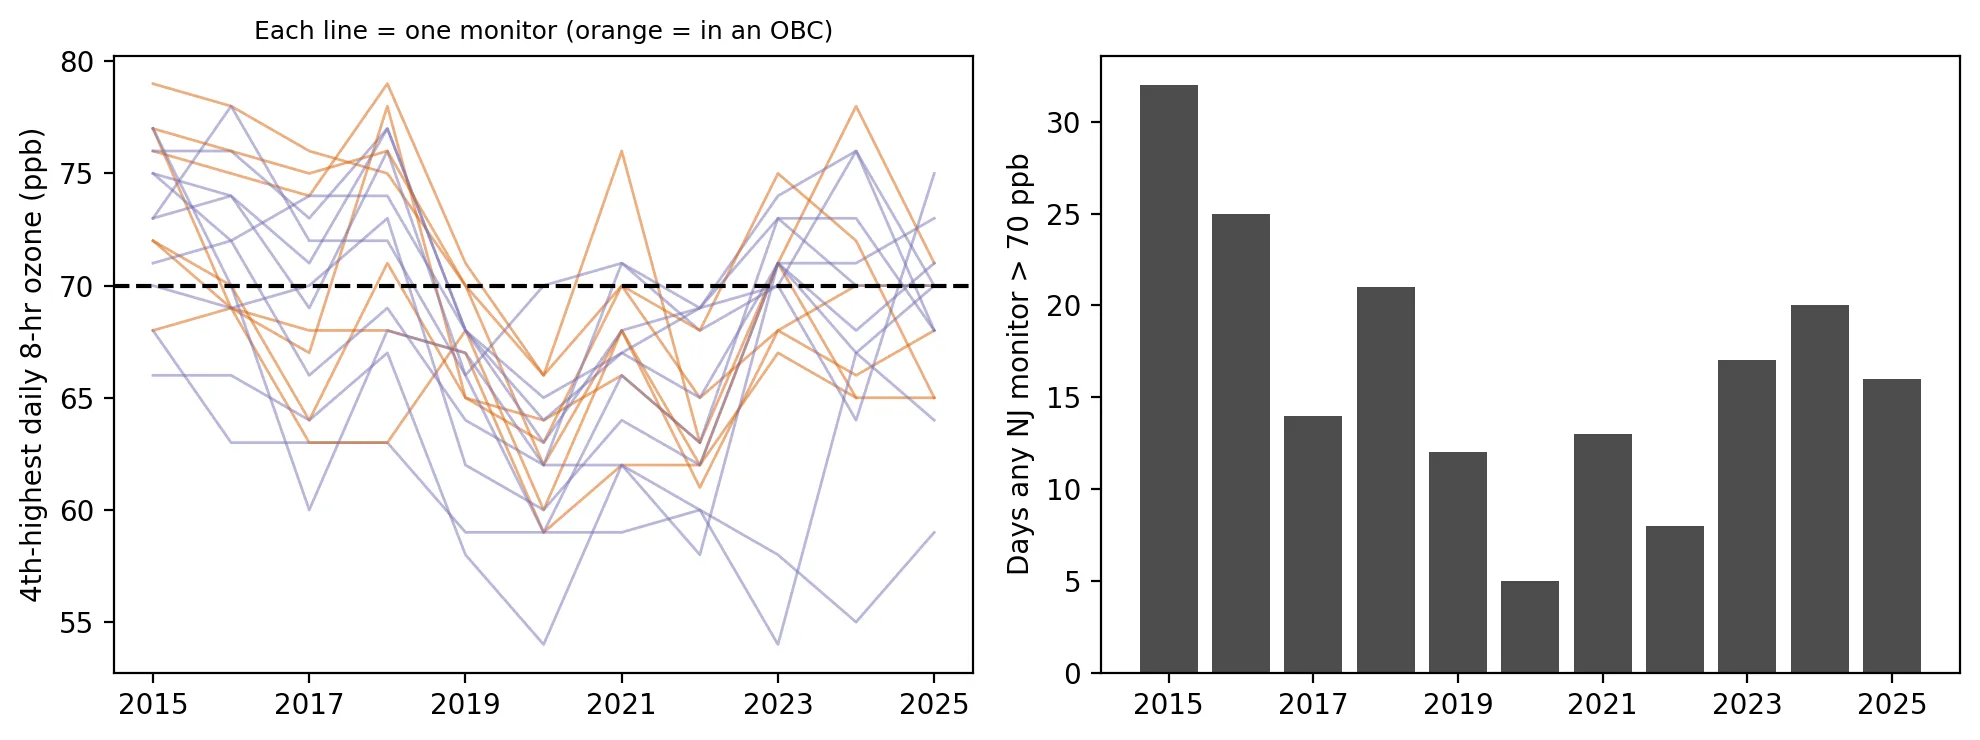
Measure ozone trends at New Jersey monitors from 2015 to 2025, and test whether trends differ in OBCs.
Produces: 1 figure and 1 table
Folder: projects/2026-06-decade-of-ozone/
Living Next to Industry: Who Lives Within a Mile of a Toxic-Release Facility?
Supports: Living Next to Industry: Who Lives Within a Mile of a Toxic-Release Facility?
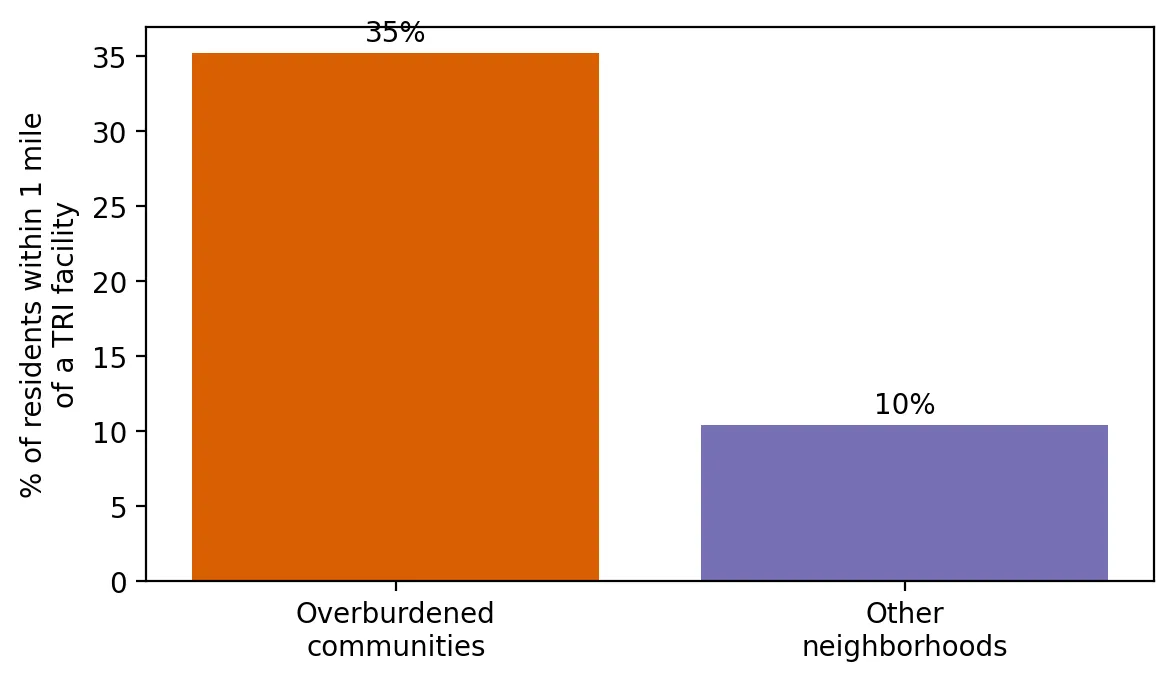
Test whether overburdened communities and communities of color are more likely to live within a mile of a TRI facility, comparing neighborhoods within the same county.
Produces: 2 figures and 1 table
Folder: projects/2026-05-living-near-industry/
Is the Water Safe? Health-Based Drinking Water Violations in New Jersey
Supports: Is the Water Safe? Health-Based Drinking Water Violations in New Jersey
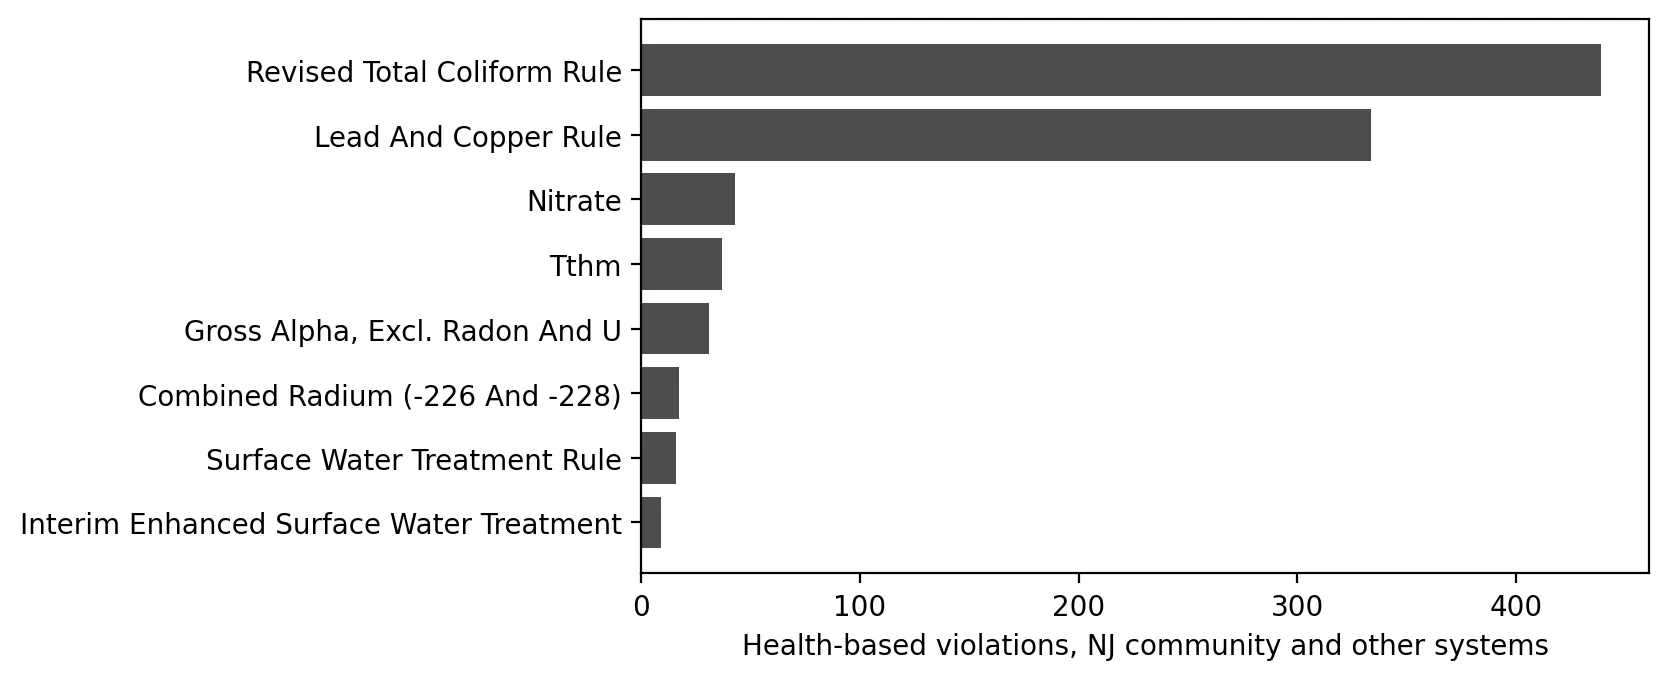
Test whether health-based violations are more frequent in systems serving overburdened communities, using an appropriate model for count data.
Produces: 2 figures and 2 tables
Folder: projects/2026-05-water-violations/
Earth Day 2026: The Air Toxics Picture in New Jersey
Supports: Earth Day 2026: The Air Toxics Picture in New Jersey
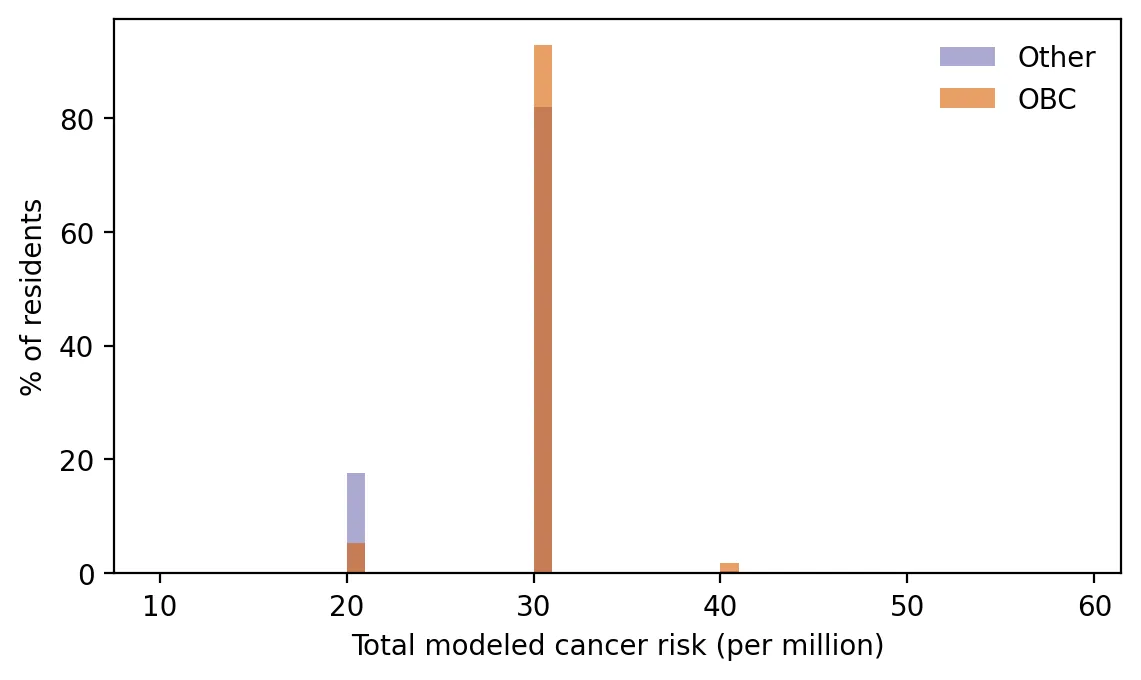
Compare modeled air toxics cancer risk between OBC and non-OBC residents, with uncertainty, and identify which sources drive the gap.
Produces: 2 figures and 1 table
Folder: projects/2026-04-air-toxics/
A New Map of Burden: What Changed When New Jersey Updated Its Overburdened Communities
Supports: A New Map of Burden: What Changed When New Jersey Updated Its Overburdened Communities
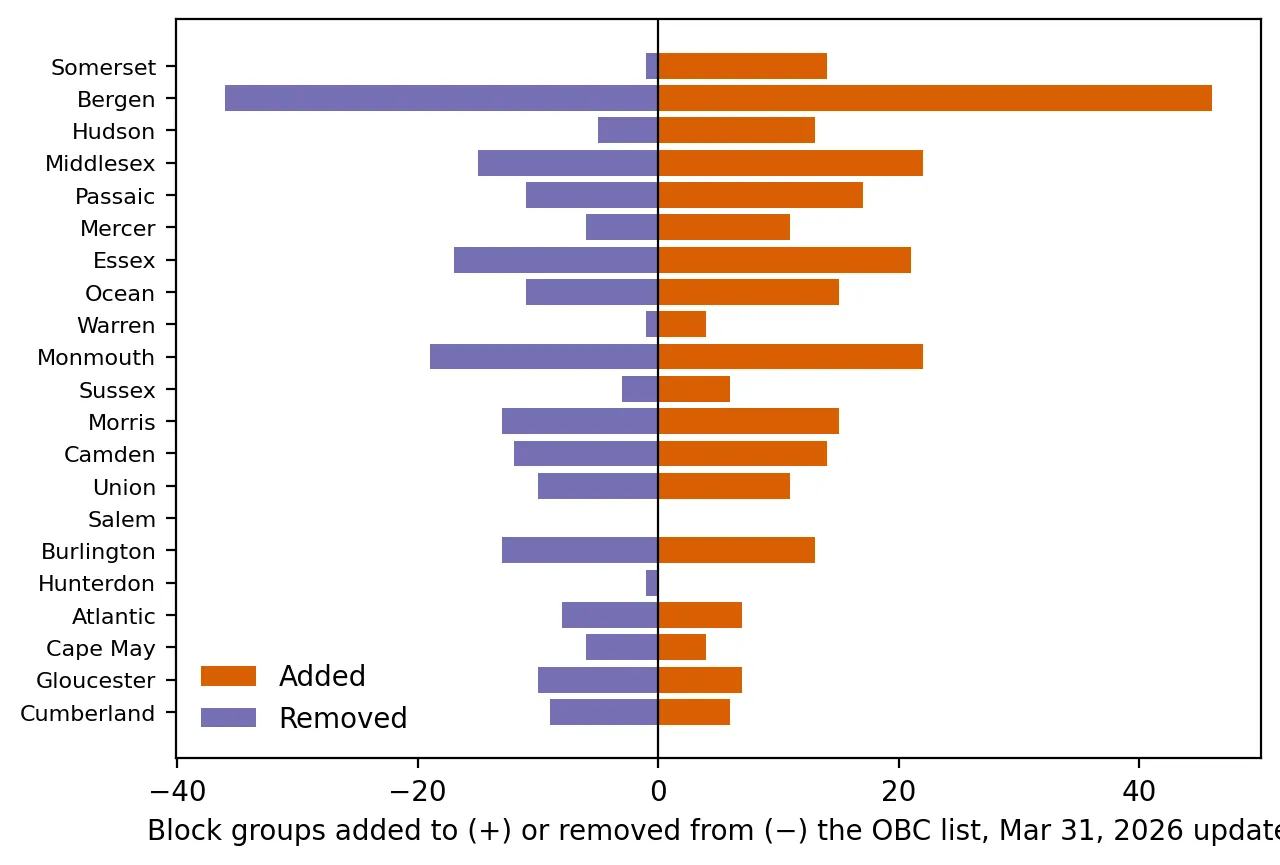
Measure what changed between two versions of NJDEP's environmental justice dataset, and why.
Produces: 2 figures and 2 tables
Folder: projects/2026-04-new-map/
Five Years Left: Can New Jersey Replace Its Lead Pipes by 2031?
Supports: Five Years Left: Can New Jersey Replace Its Lead Pipes by 2031?
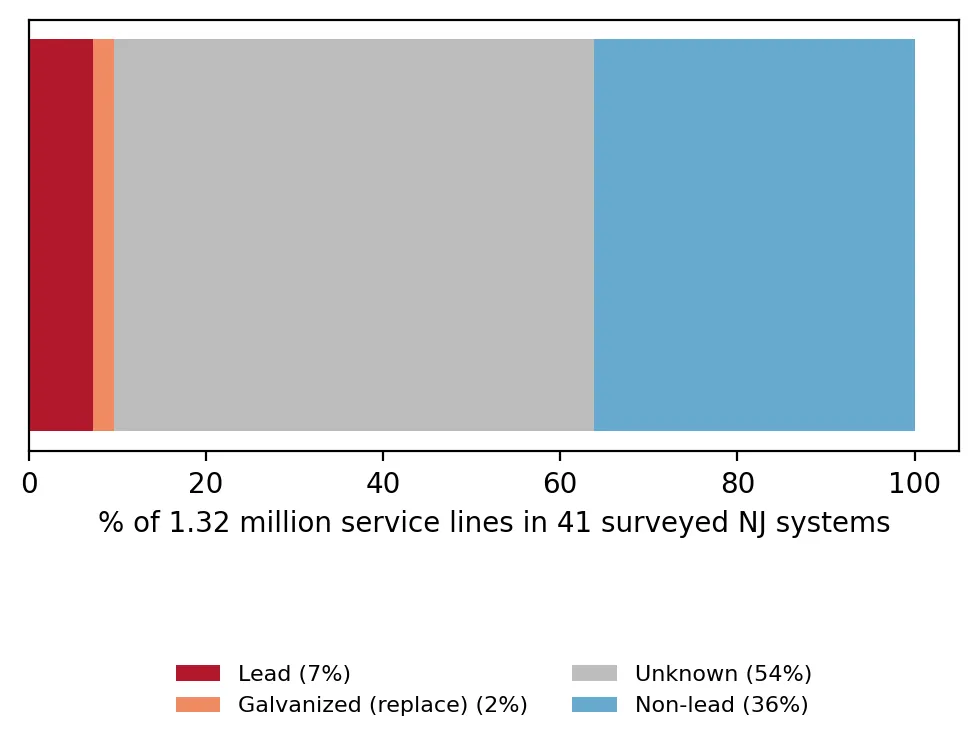
Describe New Jersey's service line inventory and test whether lead-line share relates to OBC share, with honest uncertainty.
Produces: 2 figures and 1 table
Folder: projects/2026-03-five-years-left/
Sewage in the Rain: After Accounting for Weather, Are New Jersey's Sewer Overflows Declining?
Supports: Sewage in the Rain: After Accounting for Weather, Are New Jersey's Sewer Overflows Declining?
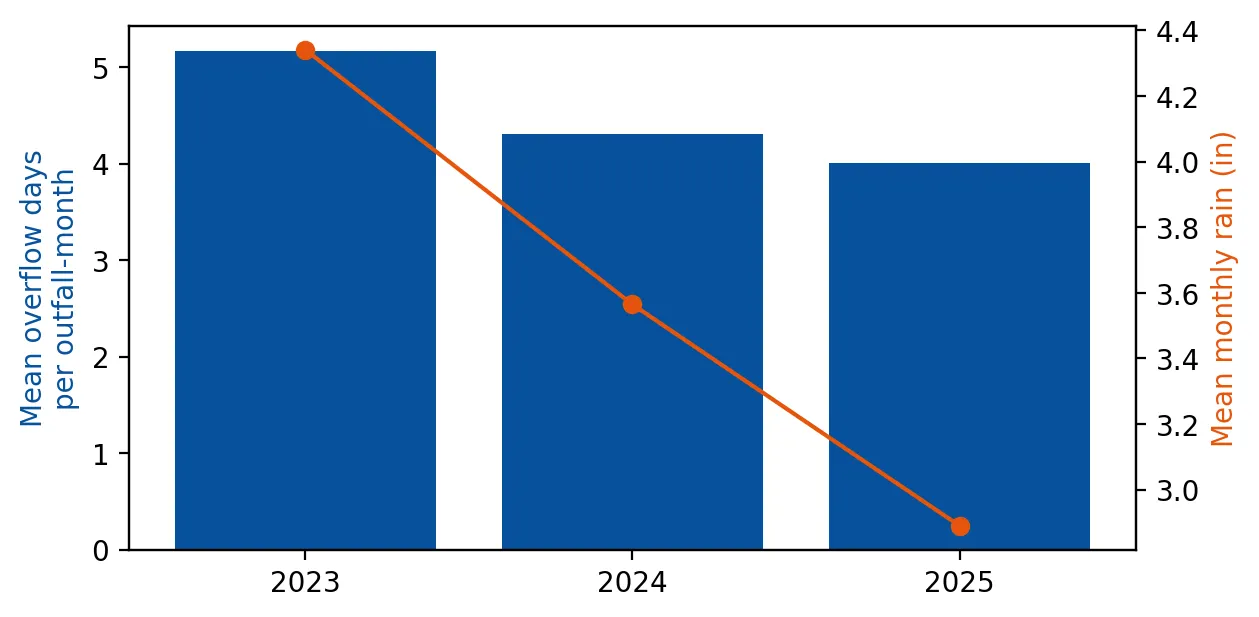
Estimate rain-adjusted changes in combined sewer overflows from 2023 to 2025.
Produces: 2 figures and 2 tables
Folder: projects/2026-02-sewage-in-the-rain/
Where Do You Draw the Line? How Three Numbers Decide Who Is 'Overburdened'
Supports: Where Do You Draw the Line? How Three Numbers Decide Who Is 'Overburdened'
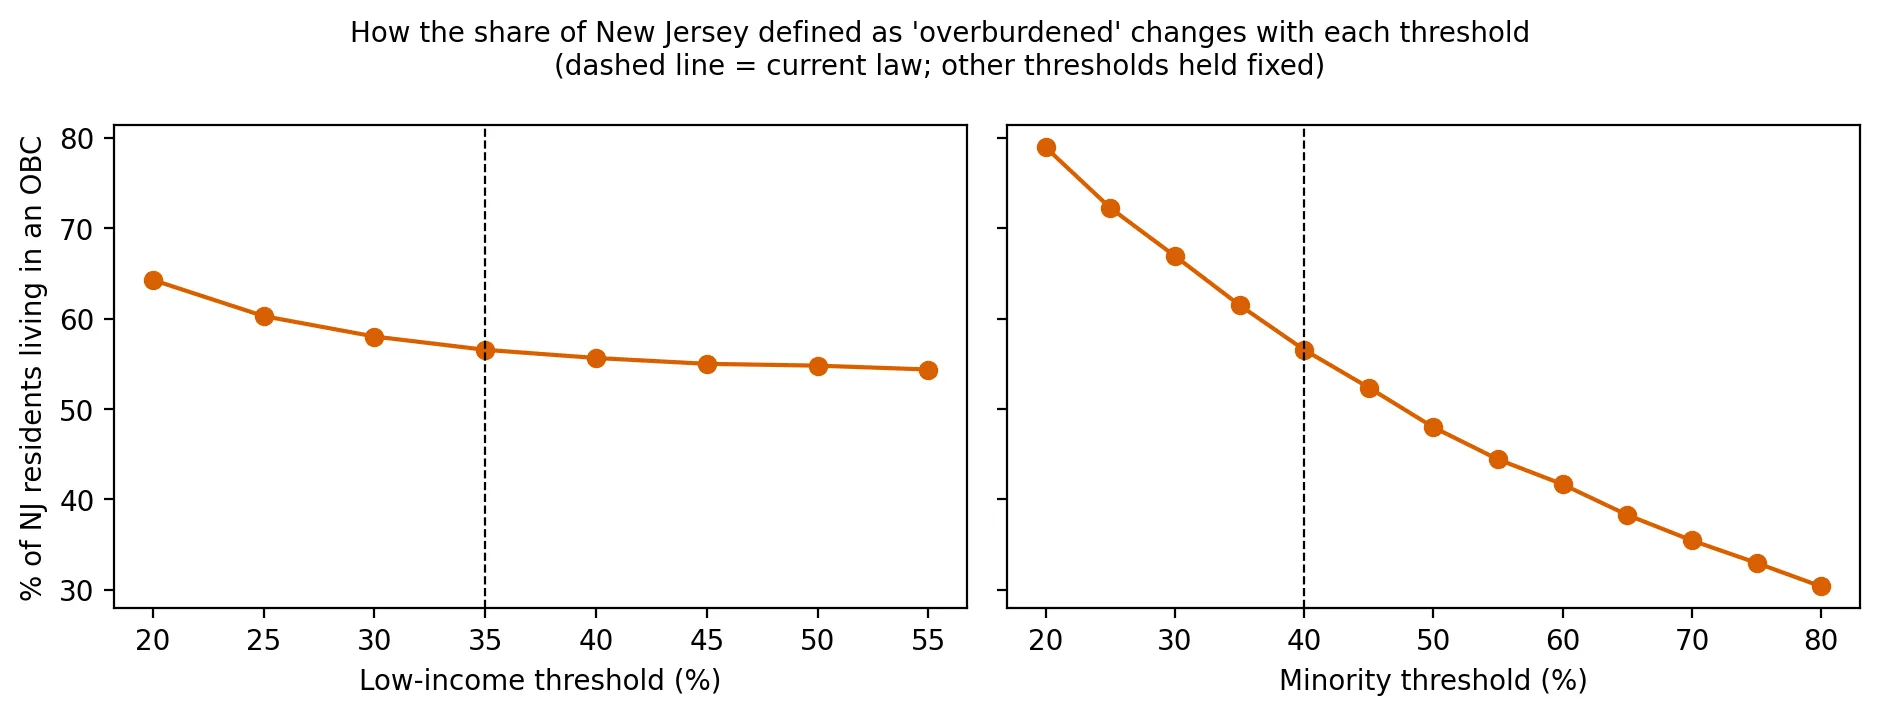
Recreate the OBC list from its definition and test how it changes with different thresholds.
Produces: 2 figures and 1 table
Folder: projects/2026-01-drawing-the-line/
The Court Upholds the Rules: What the Appellate Division Decided, and Can We Check NJDEP's Math?
Supports: The Court Upholds the Rules: What the Appellate Division Decided, and Can We Check NJDEP's Math?
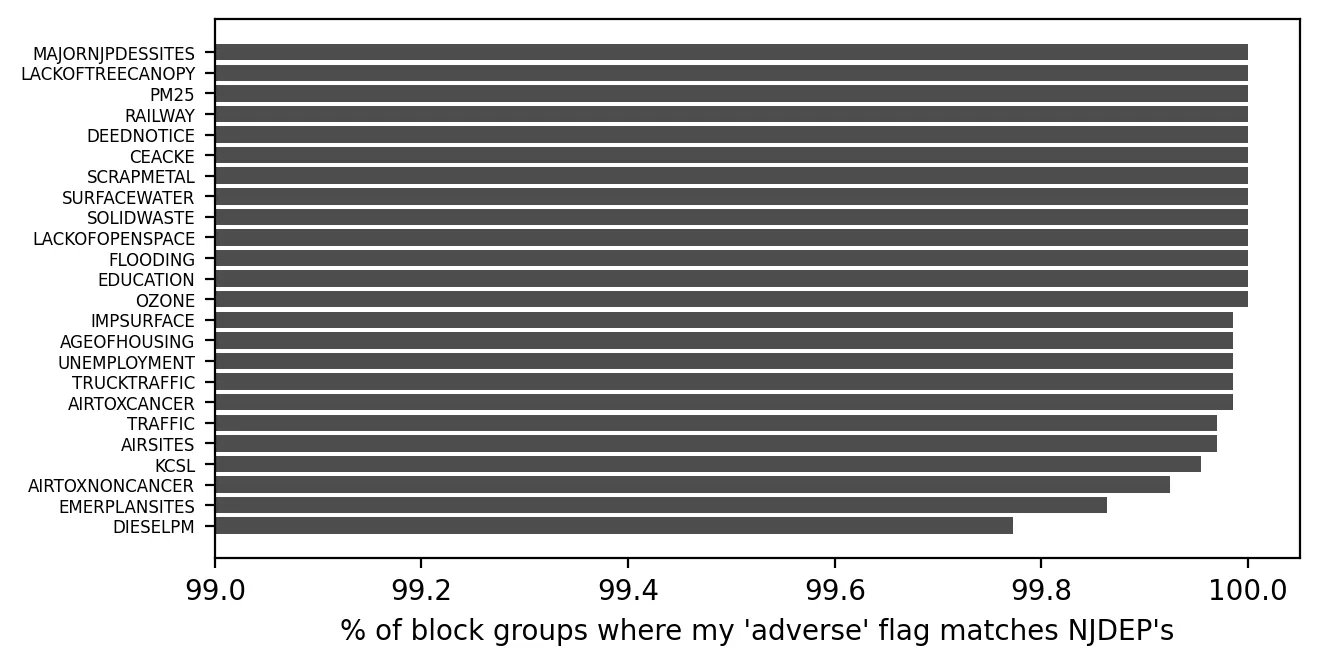
Recompute NJDEP's adverse stressor flags, Combined Stressor Totals, and cumulative-stressor determinations, and measure agreement.
Produces: 2 figures and 1 table
Folder: projects/2026-01-court-upholds/
The Warehouse Boom: Are Trucks and Diesel Concentrated in Overburdened Communities?
Supports: The Warehouse Boom: Are Trucks and Diesel Concentrated in Overburdened Communities?
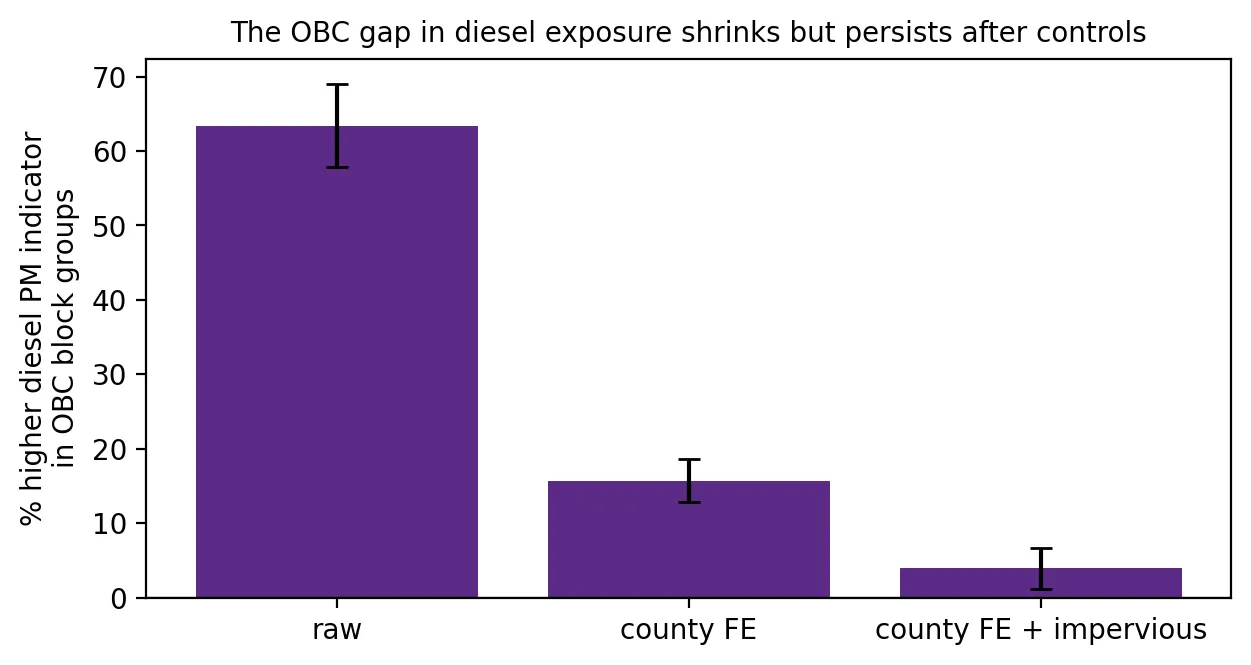
Test whether truck and diesel exposure is higher in OBCs after accounting for county and urbanization.
Produces: 2 figures and 2 tables
Folder: projects/2025-12-warehouse-boom/
The Ironbound's Fourth Power Plant: A Court Hits Pause
Supports: The Ironbound's Fourth Power Plant: A Court Hits Pause
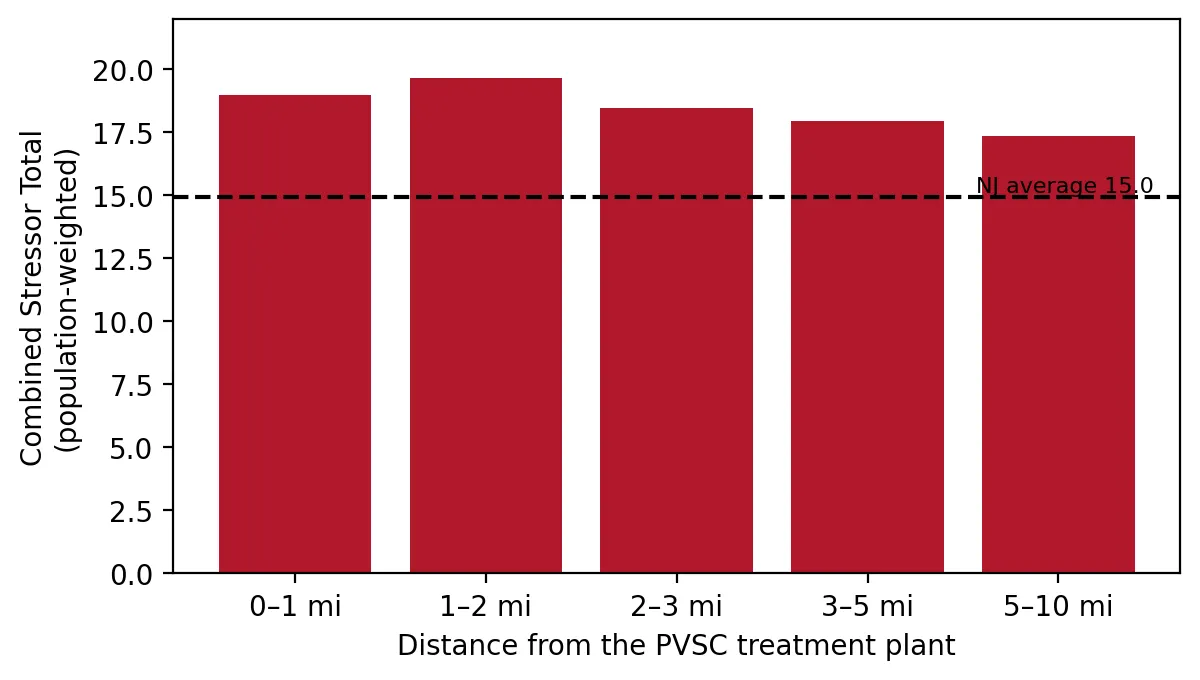
Summarize cumulative burden in rings around PVSC.
Produces: 2 figures and 1 table
Folder: projects/2025-11-ironbound-stay/
Lead in Children's Blood: What the State's Newest Report Showed, and Why It Was Already Three Years Old
Supports: Lead in Children's Blood: What the State's Newest Report Showed, and Why It Was Already Three Years Old
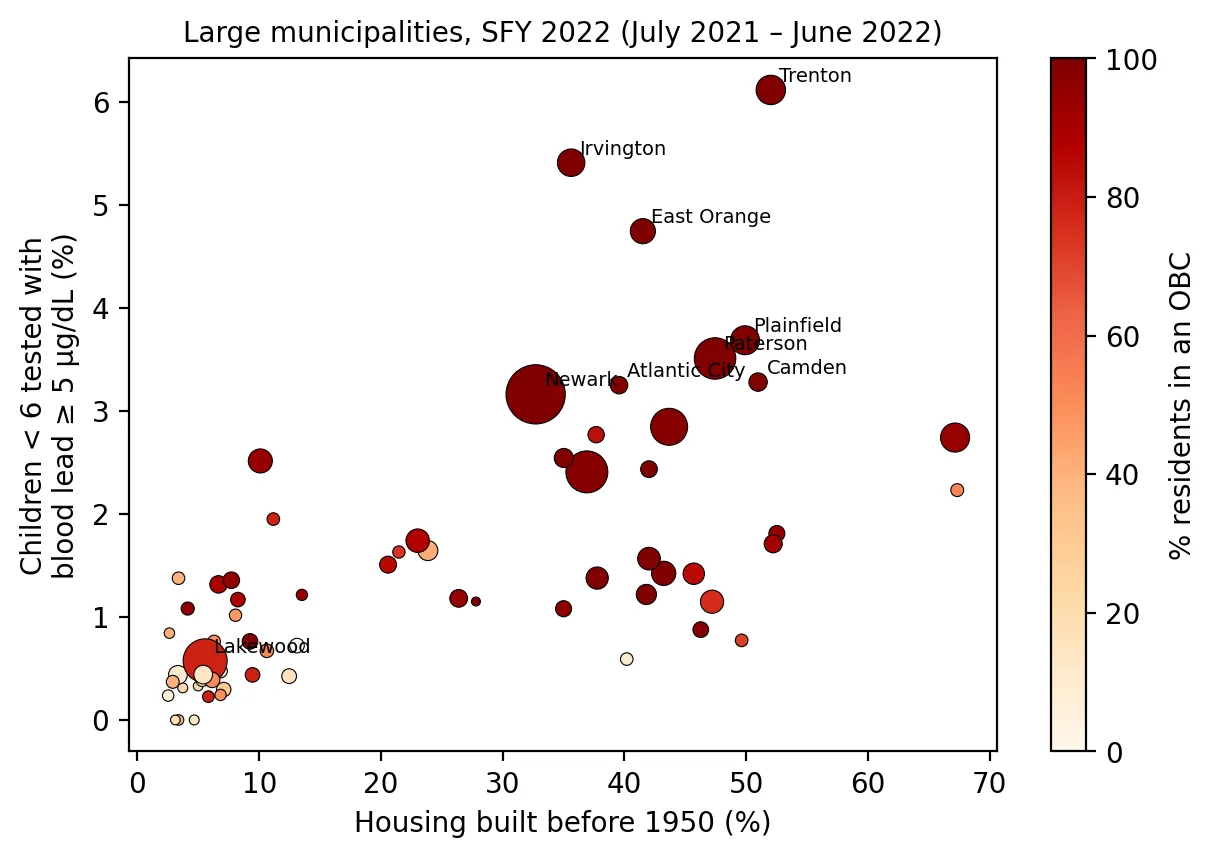
Extract municipal blood lead tables from two NJDOH PDFs and explain differences across towns.
Produces: 1 figure and 1 table
Folder: projects/2025-10-childhood-lead/
Five Years After the EJ Law: Contaminated Sites Next Door
Supports: Five Years After the EJ Law: Contaminated Sites Next Door
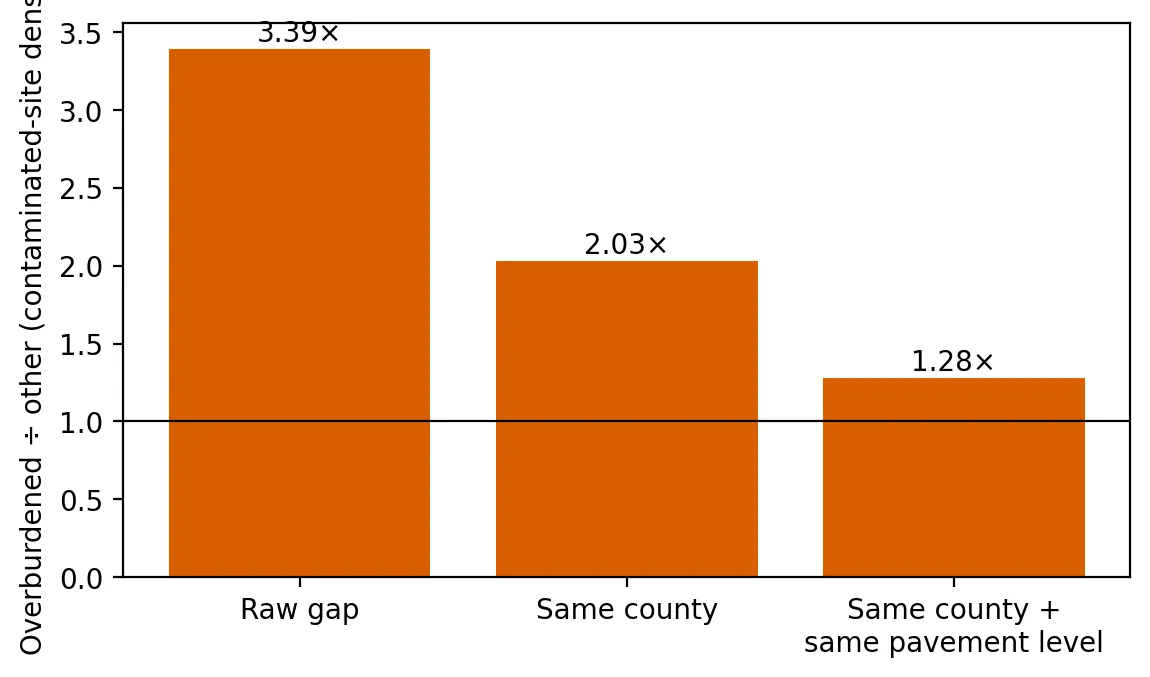
Test whether contaminated-site density is higher in overburdened communities even after comparing neighborhoods within the same county and with similar development.
Produces: 2 figures and 2 tables
Folder: projects/2025-09-contaminated-sites/
Chemical Fingerprints: What the DuPont Settlement Means, and What South Jersey's Water Shows
Supports: Chemical Fingerprints: What the DuPont Settlement Means, and What South Jersey's Water Shows
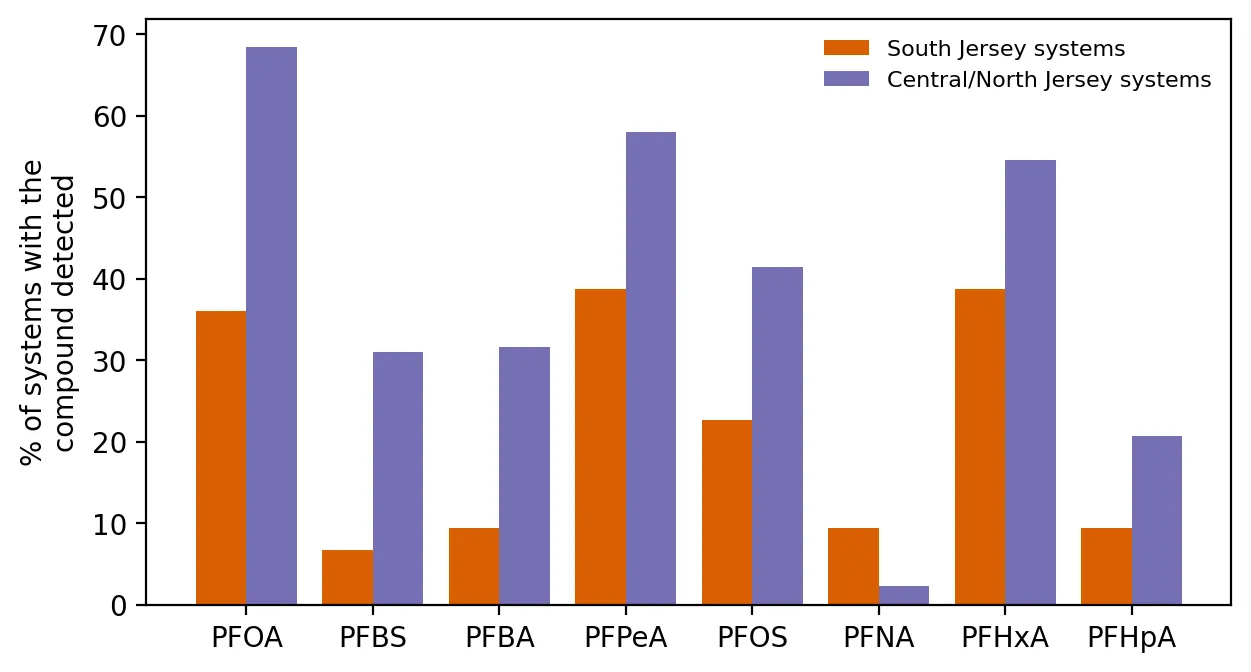
Compare PFAS detection rates between South Jersey and the rest of the state, compound by compound, and map PFNA.
Produces: 2 figures and 2 tables
Folder: projects/2025-08-chambers-works/
Planting Shade: Where New Jersey's New Heat Program Could Do the Most Good
Supports: Planting Shade: Where New Jersey's New Heat Program Could Do the Most Good
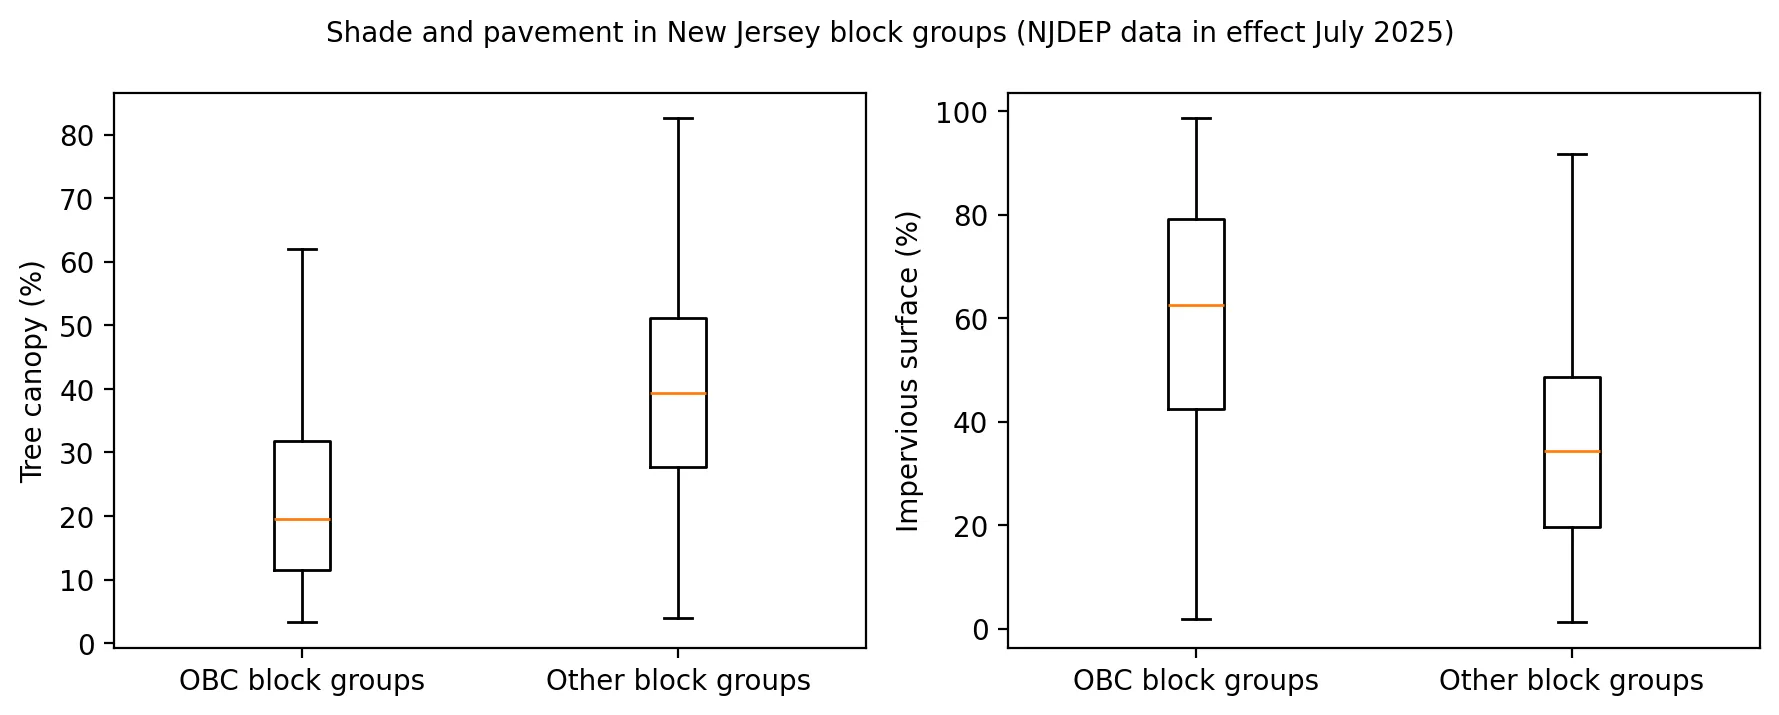
Compare shade and pavement between OBCs and other block groups, then separate their effects on municipal heat.
Produces: 2 figures and 1 table
Folder: projects/2025-07-planting-shade/
Hottest in the City: What Satellites Show About Heat in New Jersey's Towns
Supports: Hottest in the City: What Satellites Show About Heat in New Jersey's Towns
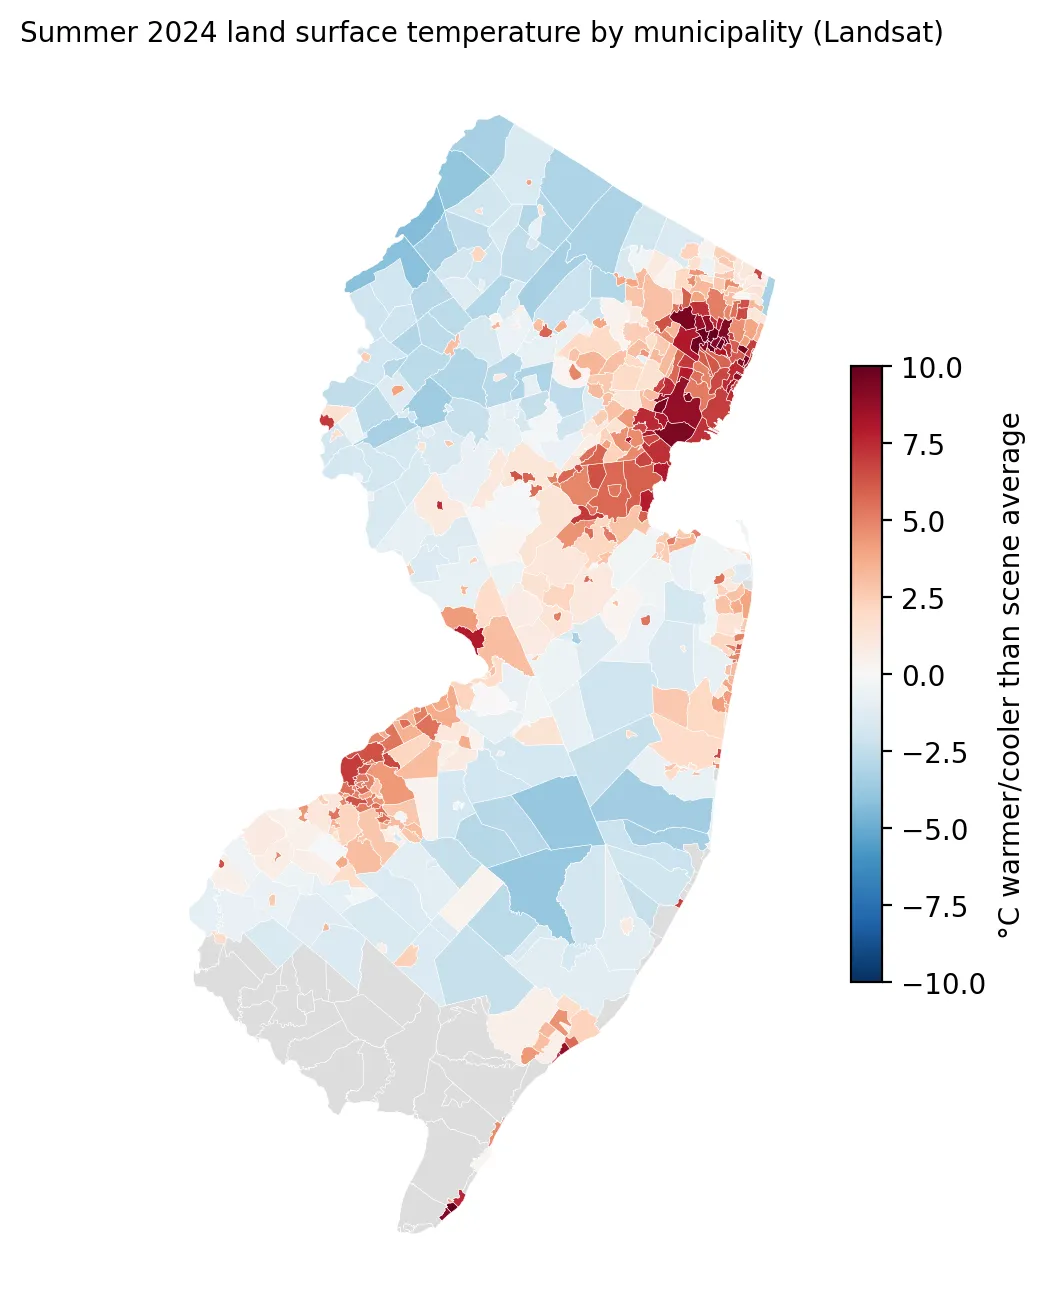
Estimate each New Jersey municipality's summer surface temperature from Landsat.
Produces: 2 figures and 1 table
Folder: projects/2025-06-heat-wave/
The Plants Behind the Bill: Who Lives Next to New Jersey's Power Plants?
Supports: The Plants Behind the Bill: Who Lives Next to New Jersey's Power Plants?
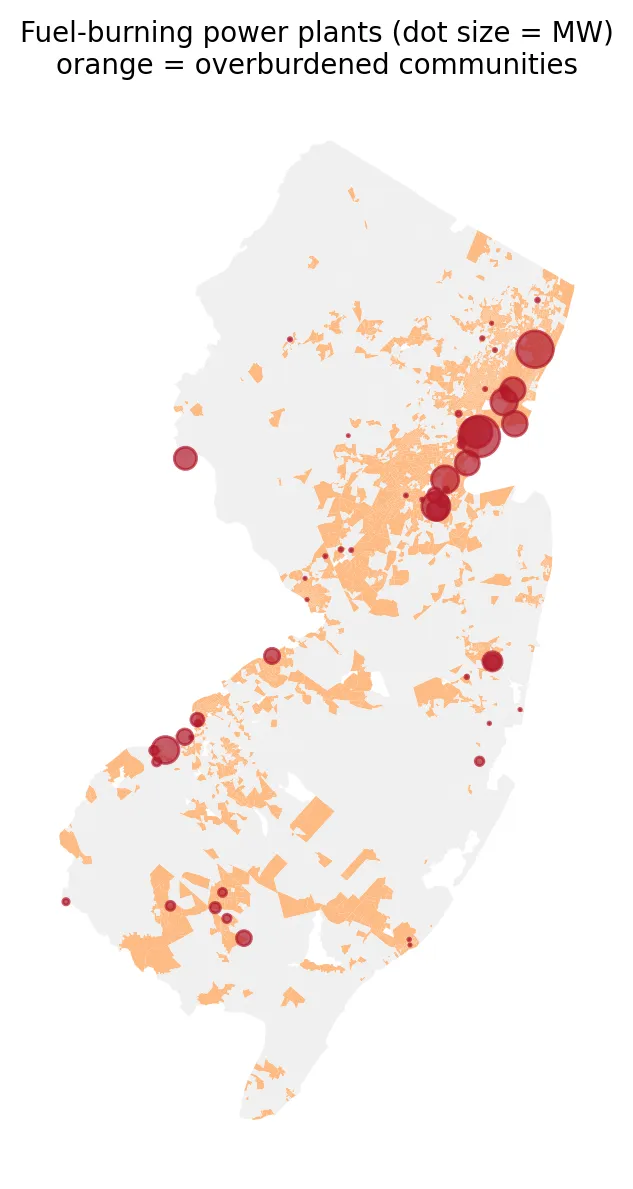
Measure how close New Jersey's fuel-burning power plants are to overburdened communities and communities of color.
Produces: 2 figures and 1 table
Folder: projects/2025-06-power-plants/
The Map EPA Took Down: What EJScreen's Last Data Showed About New Jersey
Supports: The Map EPA Took Down: What EJScreen's Last Data Showed About New Jersey
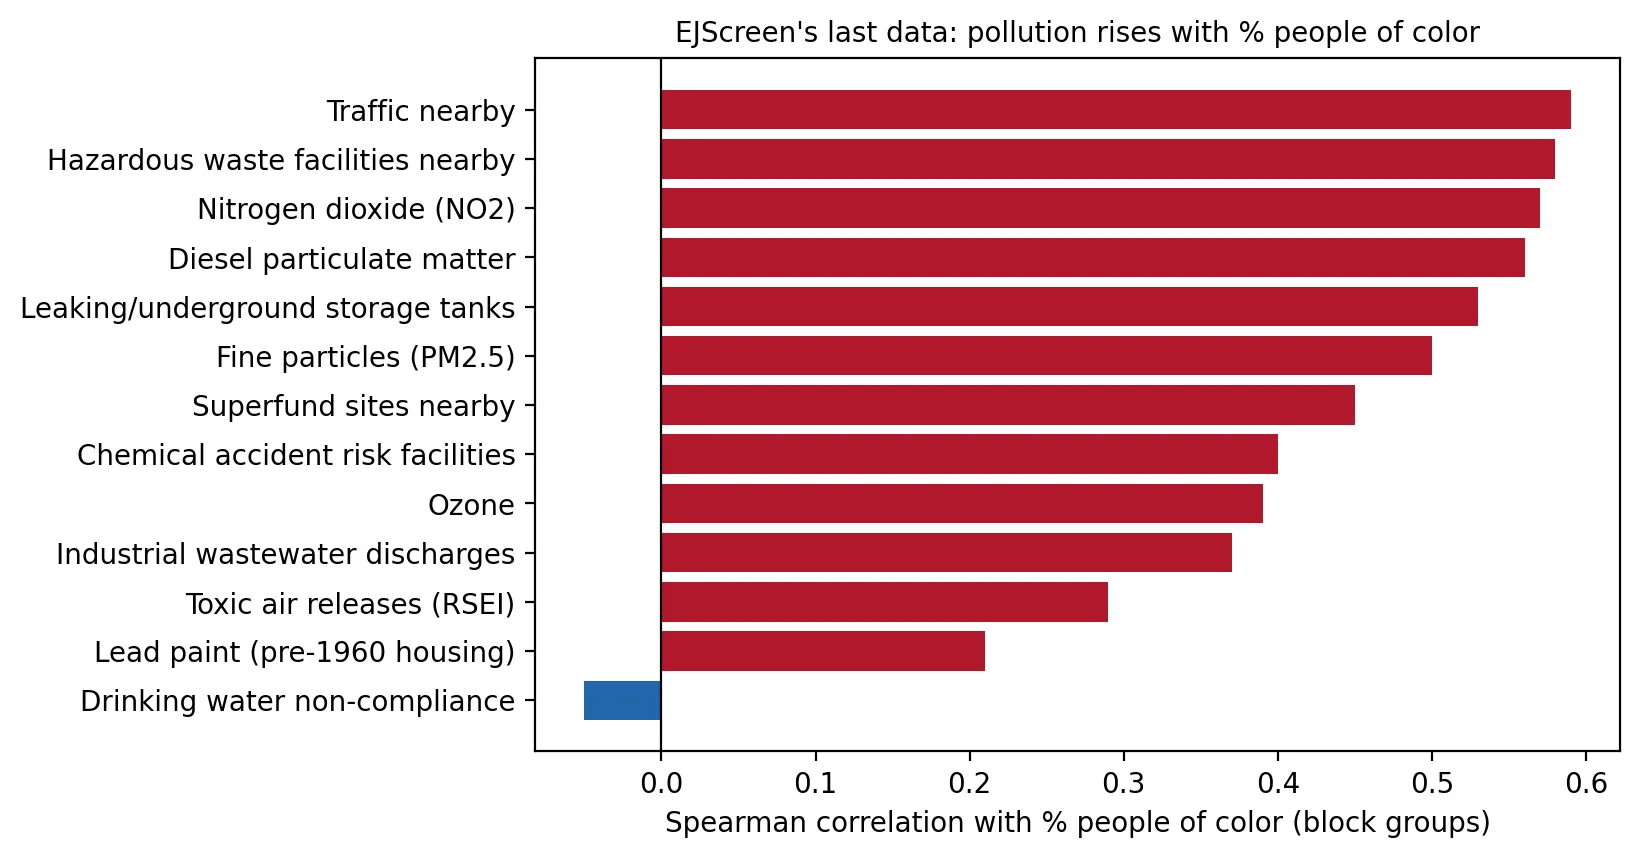
Measure how strongly each EJScreen indicator rises with the share of people of color in New Jersey neighborhoods.
Produces: 2 figures and 1 table
Folder: projects/2025-05-ejscreen/
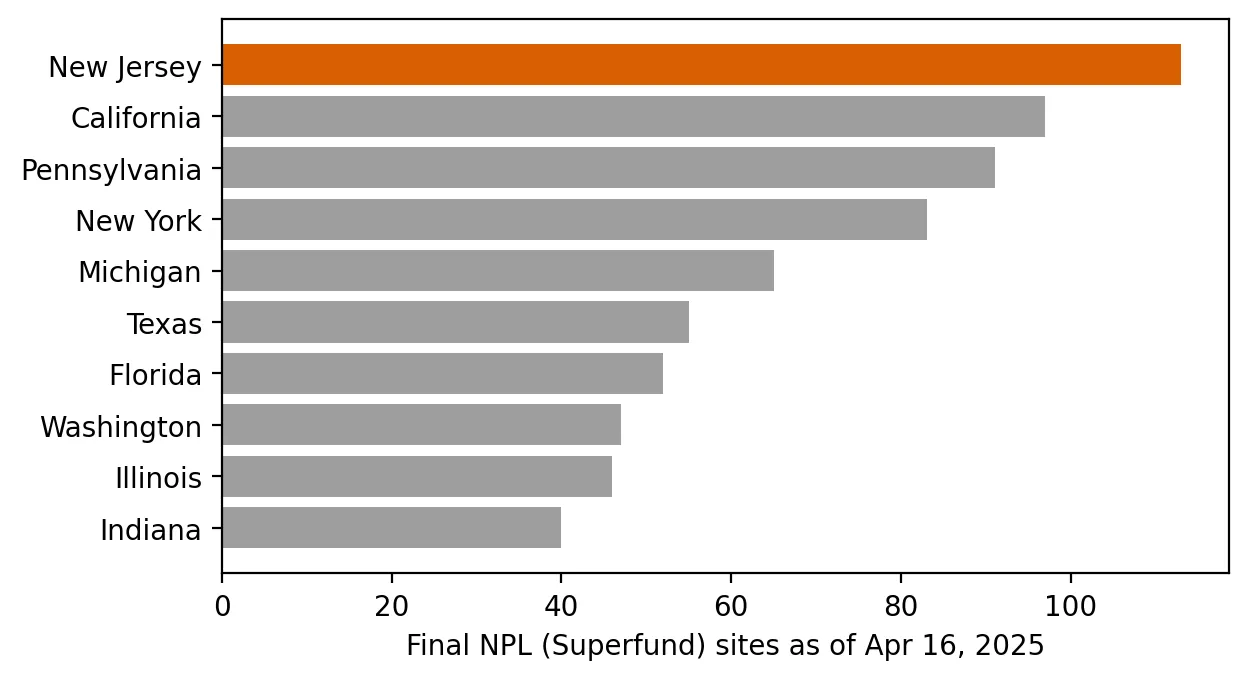
Superfund State: Who Lives Near New Jersey's 113 Most Hazardous Sites?
Supports: Superfund State: Who Lives Near New Jersey's 113 Most Hazardous Sites?
Count NPL sites as of April 16, 2025, and estimate how many people live within a mile of one.
Produces: 2 figures and 1 table
Folder: projects/2025-04-superfund-state/
The Soot Standard Under Review: Where New Jersey Stands on Fine Particle Pollution
Supports: The Soot Standard Under Review: Where New Jersey Stands on Fine Particle Pollution
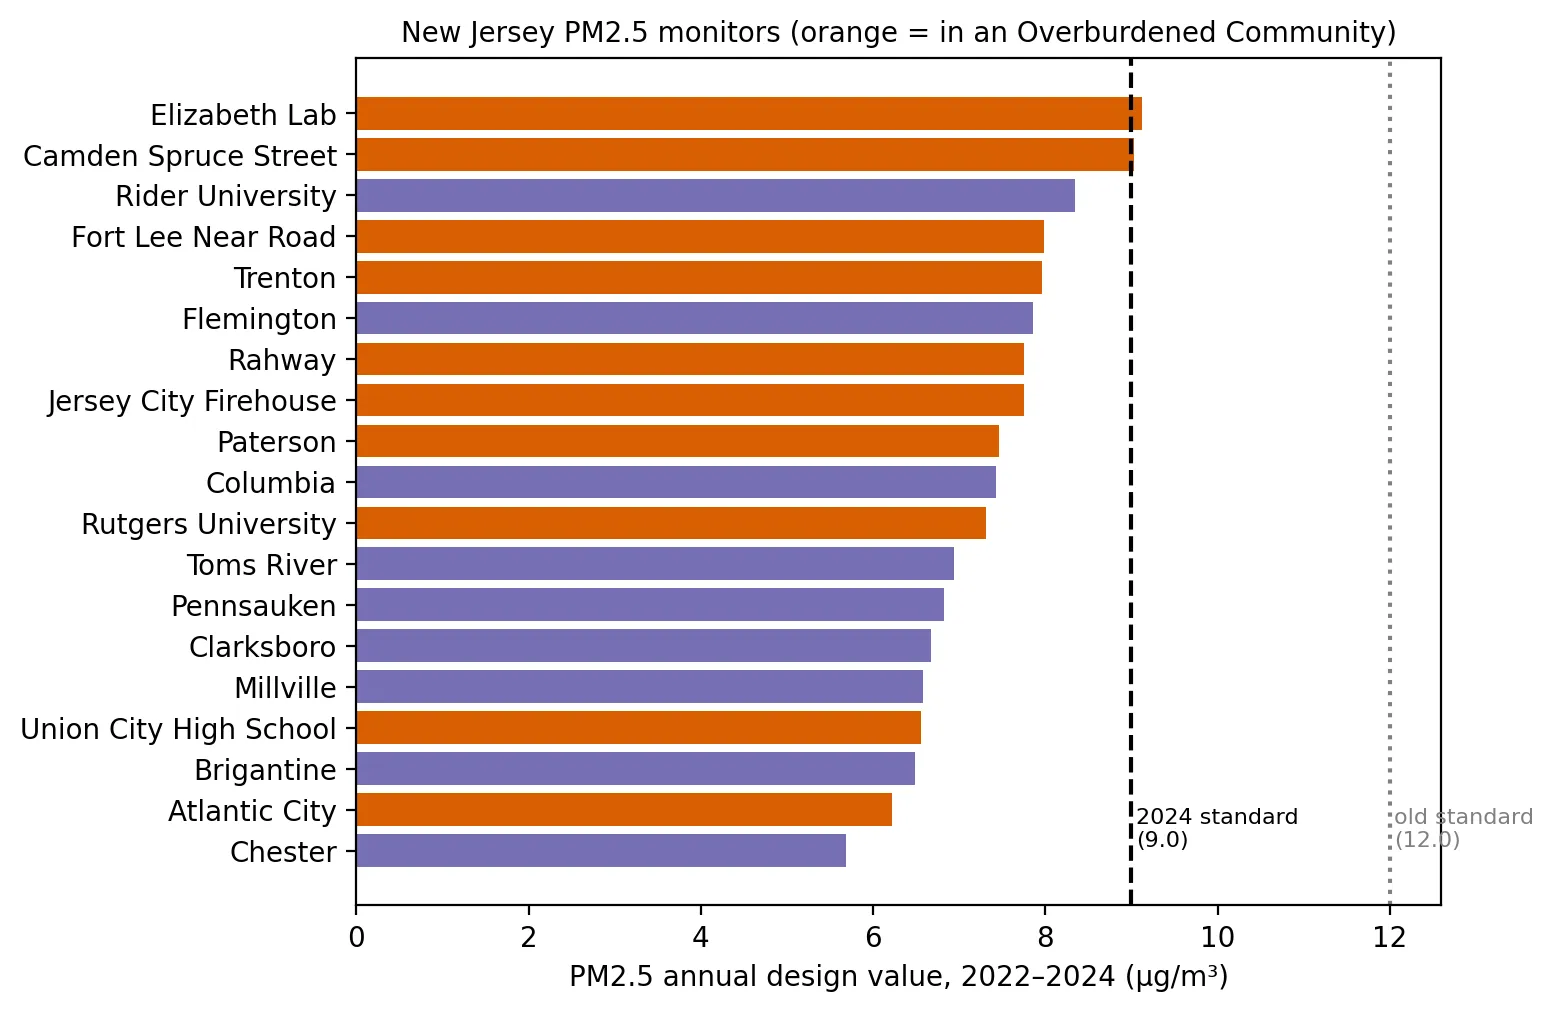
Approximate each New Jersey monitor's PM2.5 design value for 2022–2024.
Produces: 1 figure and 1 table
Folder: projects/2025-03-pm25-standard/
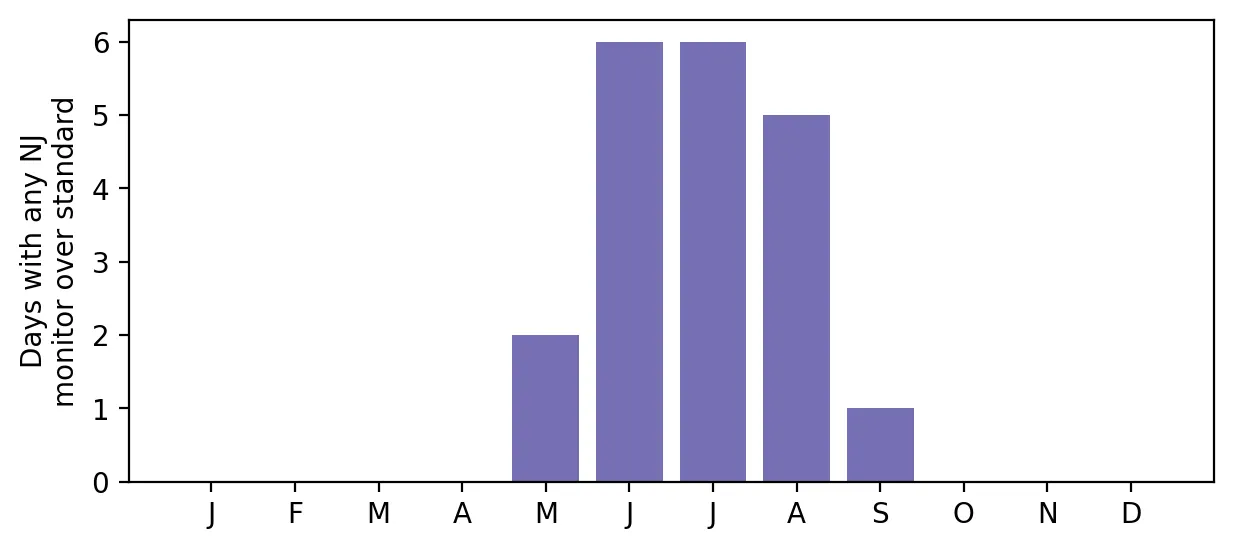
Ozone Season 2024: How Often Did New Jersey's Air Fail the Federal Standard?
Supports: Ozone Season 2024: How Often Did New Jersey's Air Fail the Federal Standard?
Count how many days each New Jersey monitor exceeded the ozone standard in 2024.
Produces: 2 figures and 1 table
Folder: projects/2025-02-ozone-2024/
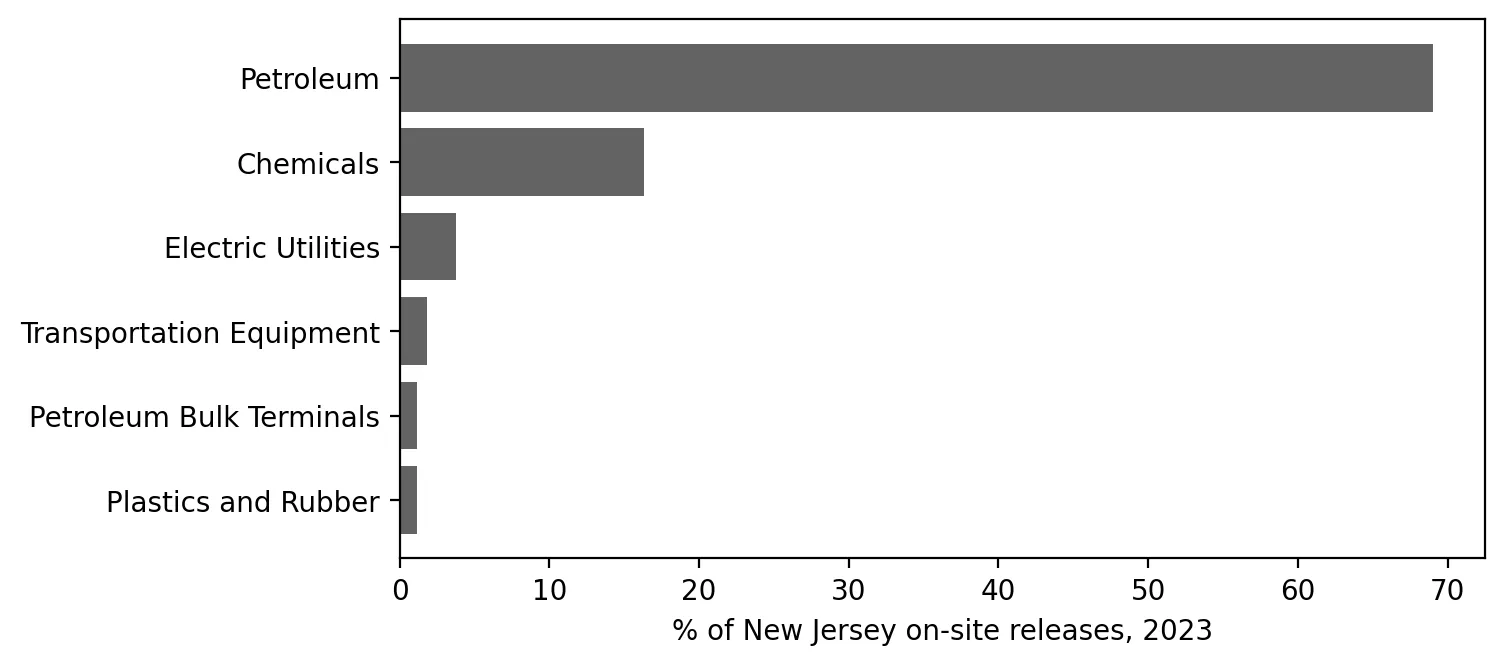
What Do New Jersey's Factories Report Releasing? A First Look at the Toxics Release Inventory
Supports: What Do New Jersey's Factories Report Releasing? A First Look at the Toxics Release Inventory
Summarize New Jersey's 2023 TRI reports by facility, industry, chemical, and county.
Produces: 2 figures and 2 tables
Folder: projects/2025-01-toxics-release-inventory/
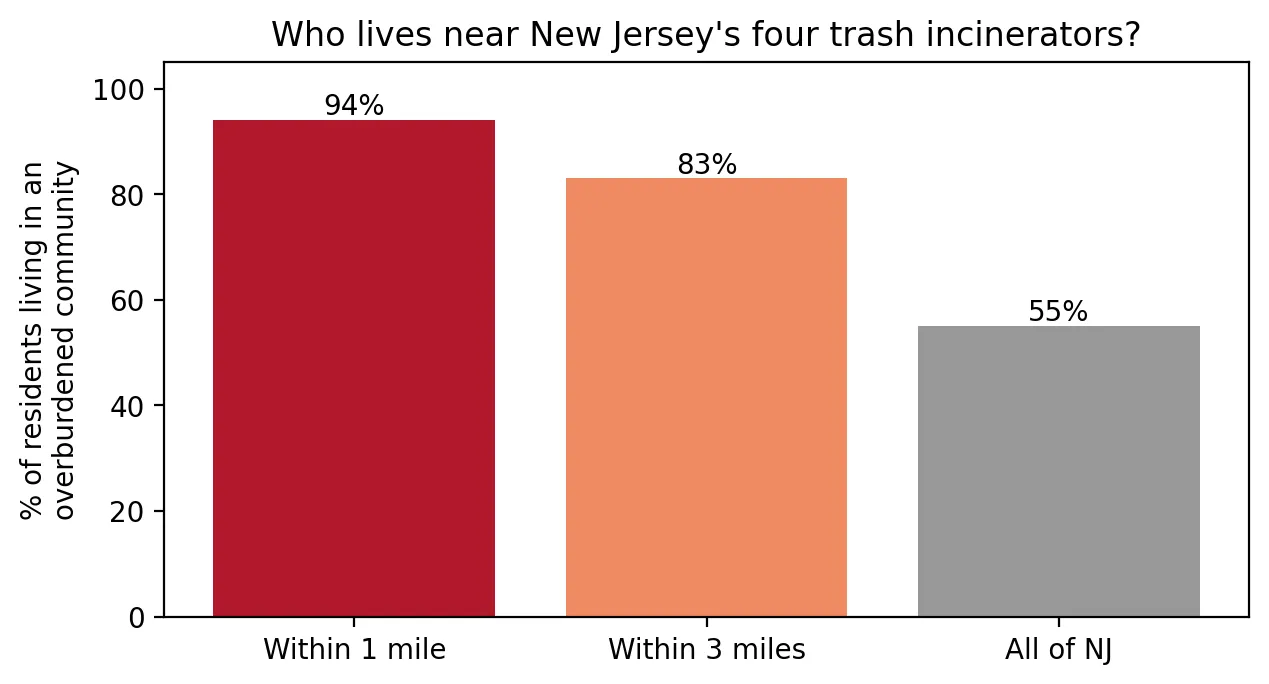
Burning Trash Next Door: Who Lives Near New Jersey's Incinerators?
Supports: Burning Trash Next Door: Who Lives Near New Jersey's Incinerators?
Find New Jersey's trash incinerators and describe who lives nearby.
Produces: 2 figures and 1 table
Folder: projects/2024-12-incinerators/
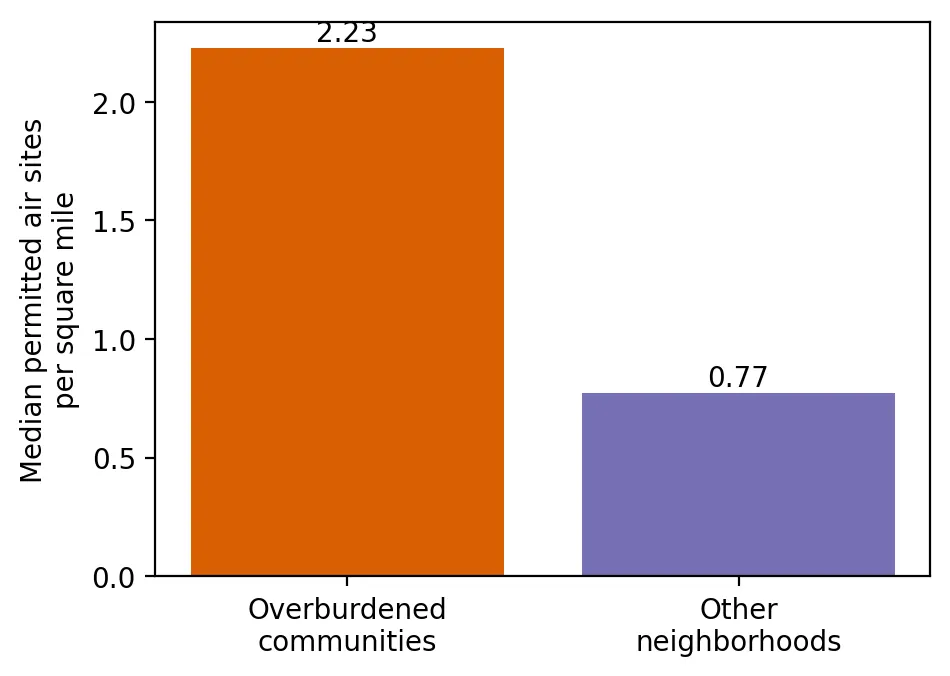
Licensed to Pollute: Who Lives Among New Jersey's Permitted Air Pollution Sources?
Supports: Licensed to Pollute: Who Lives Among New Jersey's Permitted Air Pollution Sources?
Compare how densely permitted air pollution sources are packed around overburdened and other neighborhoods.
Produces: 2 figures and 2 tables
Folder: projects/2024-10-air-permits/
Room to Breathe: Who Has Parks and Open Space Nearby?
Supports: Room to Breathe: Who Has Parks and Open Space Nearby?
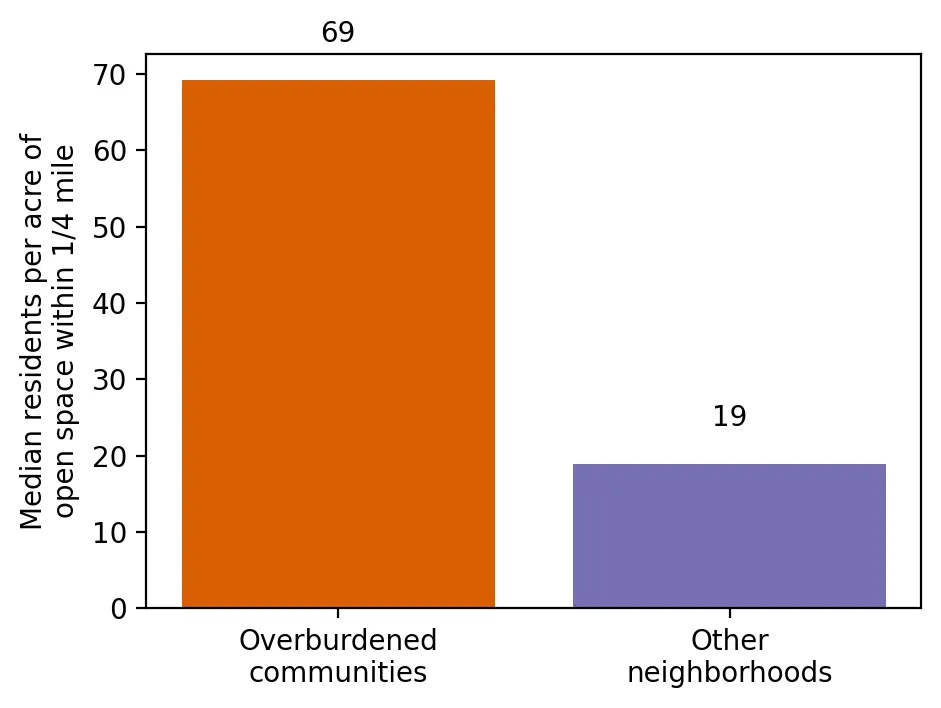
Compare access to parks and open space in overburdened and other neighborhoods.
Produces: 2 figures and 2 tables
Folder: projects/2024-07-parks/
Where the Trash Goes: Who Lives Near New Jersey's Waste and Recycling Facilities?
Supports: Where the Trash Goes: Who Lives Near New Jersey's Waste and Recycling Facilities?
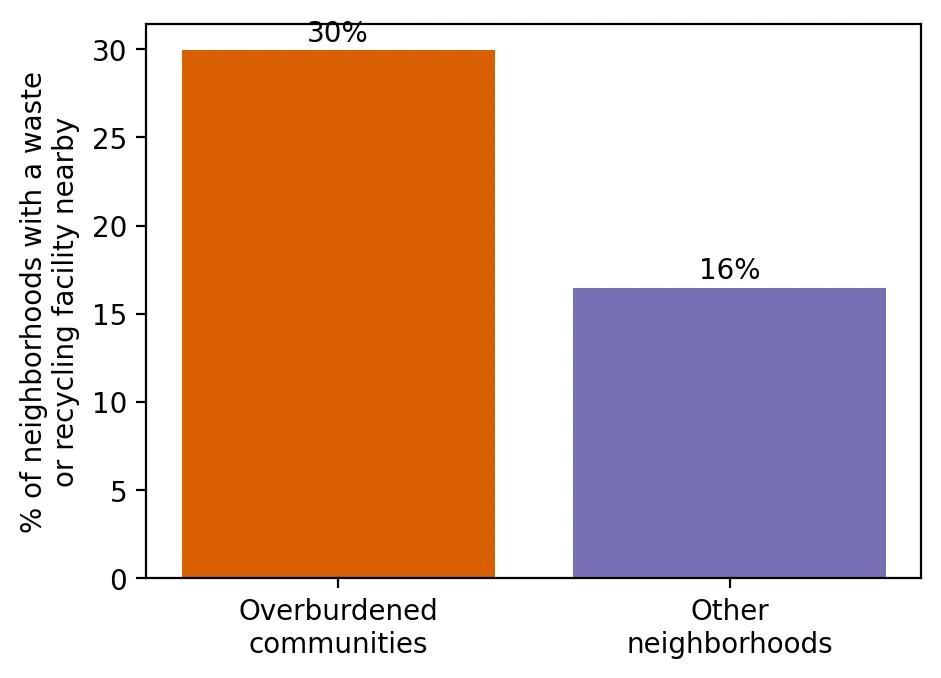
Compare how often overburdened and other neighborhoods have waste and recycling facilities.
Produces: 2 figures and 2 tables
Folder: projects/2024-04-waste-facilities/
Old Homes, Old Paint: Who Lives Where Lead Paint Is Most Likely?
Supports: Old Homes, Old Paint: Who Lives Where Lead Paint Is Most Likely?
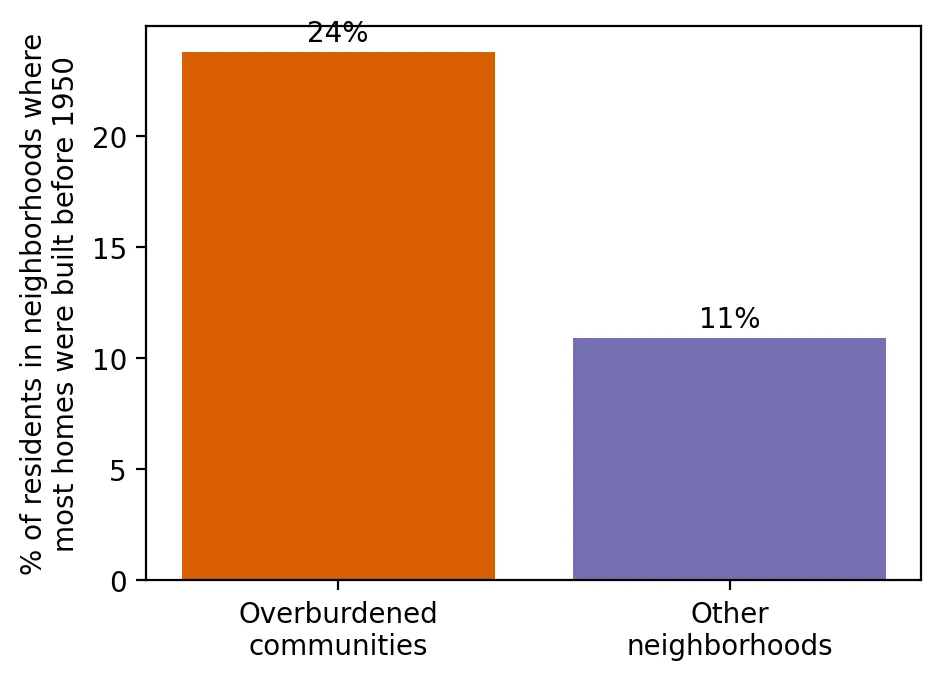
Compare how much old housing (built before 1950) overburdened communities and other neighborhoods have.
Produces: 2 figures and 2 tables
Folder: projects/2024-01-lead-paint/
Environmental Injustice Is Real in New Jersey: Introducing This Project
Supports: Environmental Injustice Is Real in New Jersey: Introducing This Project
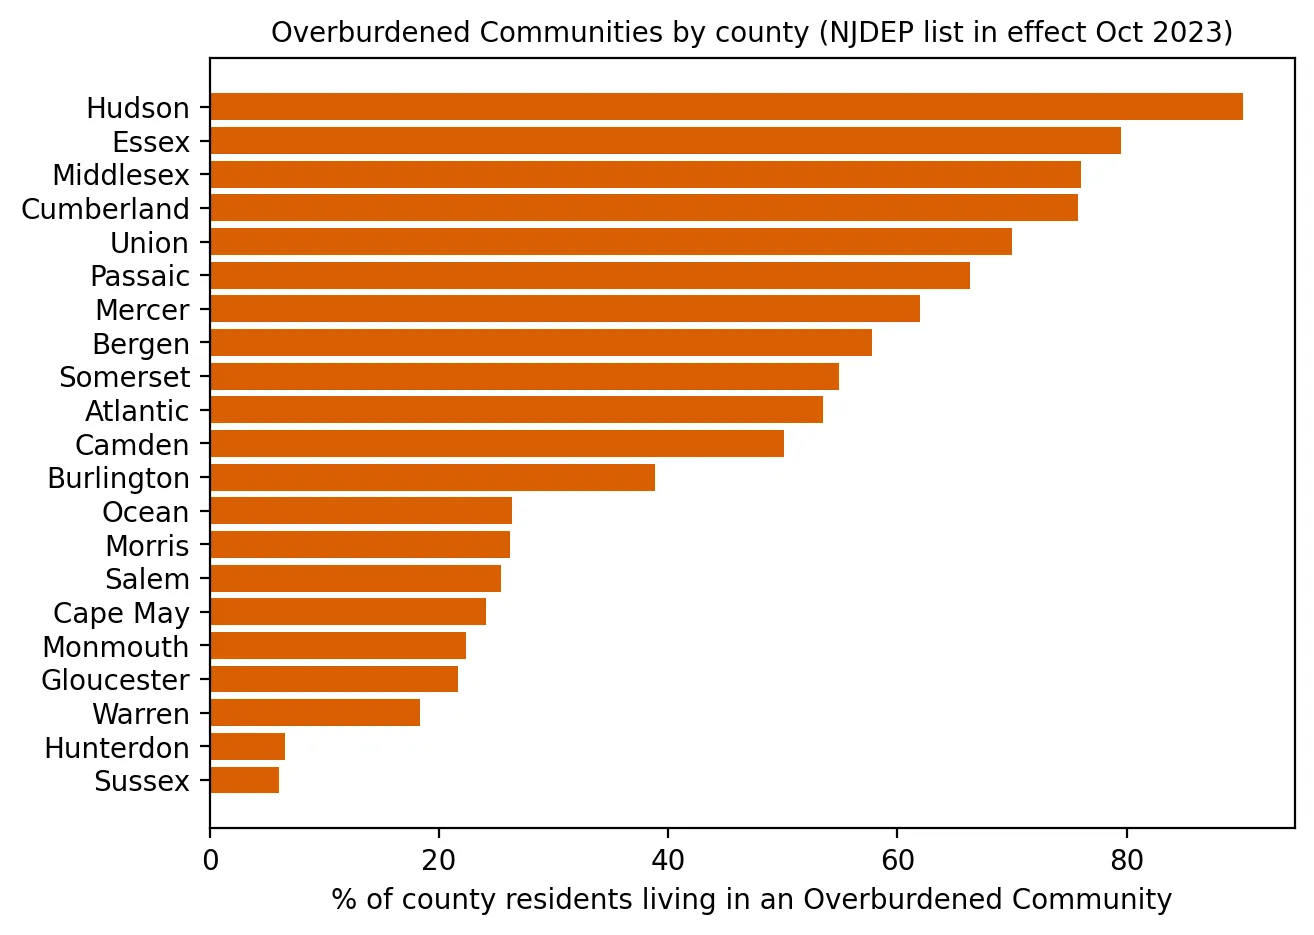
Use NJDEP's official data to count overburdened communities and compare their pollution burdens with other neighborhoods.
Produces: 3 figures and 2 tables
Folder: projects/2023-10-introduction/