
Where the Trash Goes: Who Lives Near New Jersey's Waste and Recycling Facilities?
After Earth Day
Earth Day (April 22) is a good time to think about what happens after we throw something away or drop it in the recycling bin. Much of it goes first to a transfer station or recycling facility, where garbage trucks unload, materials are sorted, and waste is loaded onto bigger trucks or trains headed for landfills and incinerators. These facilities can bring heavy truck traffic, diesel exhaust, noise, odors, and dust.
New Jersey’s Environmental Justice Law lists “transfer station or other solid waste facility, or recycling facility intending to receive at least 100 tons of recyclable material per day” and landfills among the eight kinds of facilities that need extra review in overburdened communities (New Jersey Legislature, 2020). This post asks: who lives near New Jersey’s waste and recycling facilities?
Data
NJDEP’s EJ data include a “Solid Waste Facilities” measure for every neighborhood (census block group): the number of permitted solid waste facilities per square mile (NJDEP, 2024). I used the version in effect in April 2024 and compared 6,526 populated neighborhoods.
Findings
Twice as likely to have a waste facility nearby
| Overburdened communities | Other neighborhoods | |
|---|---|---|
| Neighborhoods with at least one waste facility | 30% | 16% |
| Residents of those neighborhoods | 1,583,268 | 713,104 |
| Average facility density (sites per square mile) | 0.104 | 0.029 (3.6× lower) |
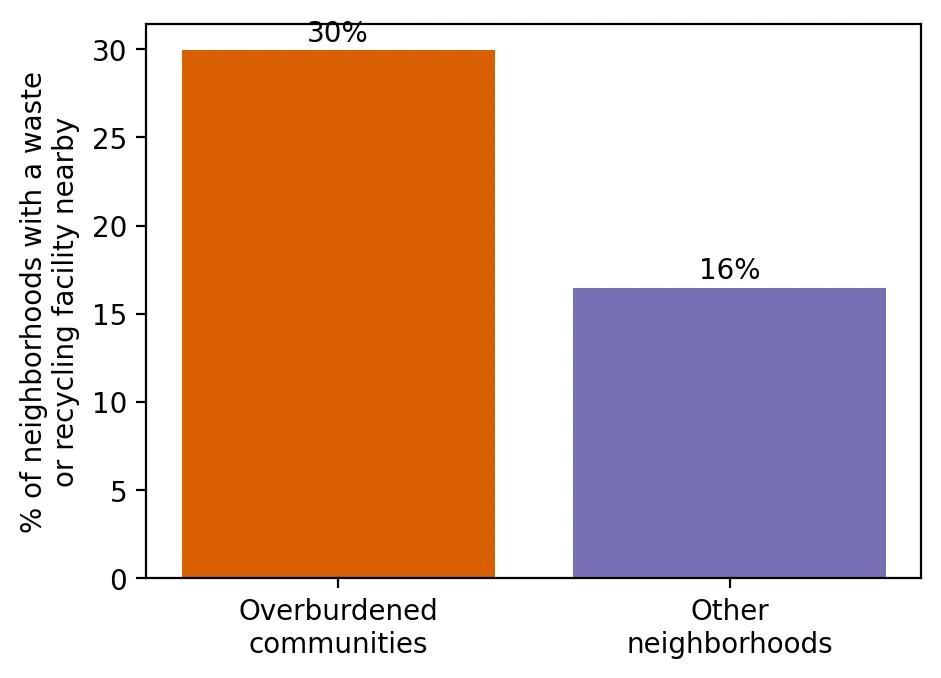 Figure 2. Overburdened communities are almost twice as likely to have a waste or recycling facility nearby.
Overburdened communities are almost twice as likely to have a waste facility, and their average facility density is 3.6 times higher. Of everyone living in a neighborhood with a waste facility, 69% live in overburdened communities, more than their 55% share of the state’s population. Among the neighborhoods with the densest concentrations of waste facilities, 83% are overburdened communities.
It rises with the share of people of color
| Neighborhoods grouped by % people of color | Avg. % people of color | % with a waste facility |
|---|---|---|
| Fewest | 8% | 13% |
| 2nd | 23% | 18% |
| Middle | 41% | 21% |
| 4th | 66% | 28% |
| Most | 92% | 38% |
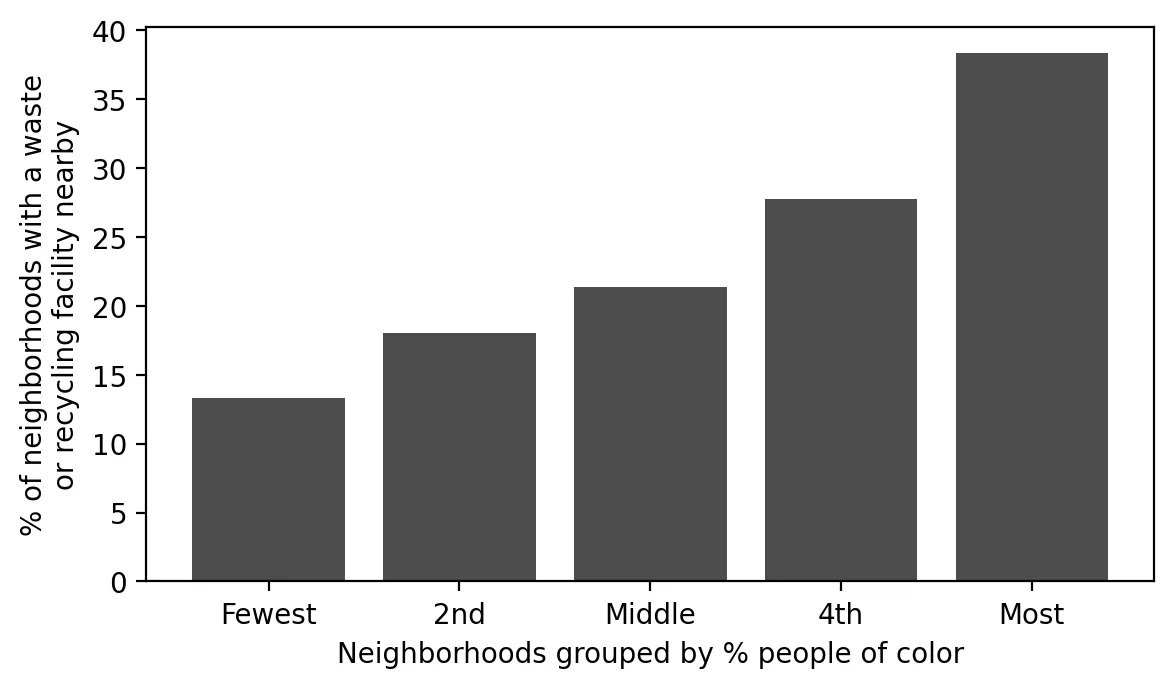 Figure 1. The share of neighborhoods with a waste facility rises with the share of people of color.
The share of neighborhoods with a waste facility rises at every step, from 13% of the least diverse neighborhoods to 38% of the most diverse, nearly three times as many.
County by county
In 14 of New Jersey’s 21 counties, a larger share of overburdened neighborhoods than other neighborhoods have a waste facility.
Why this matters
Recycling and waste disposal are necessary, and everyone benefits from them. But everyone’s trash doesn’t get handled everywhere. It gets trucked to a limited number of places, and those places are disproportionately overburdened communities and communities of color. That’s why New Jersey’s Environmental Justice Law singles out these facilities for extra review.
Limitations
- Density, not impact. The measure counts facilities, not their size, truck traffic, or emissions.
- Neighborhood boundaries. A facility just across a boundary may affect people next door but count for a different neighborhood.
- Permitted facilities only. Illegal dumping isn’t included.
Code project (Level 0): counting where facilities are
Goal: Compare how often overburdened and other neighborhoods have waste and recycling facilities.
Data: NJDEP EJ Law data (version effective January 31 – July 30, 2024), “Solid Waste Facilities” (sites per square mile).
Steps:
- Load the data and keep neighborhoods with residents.
- Mark neighborhoods with at least one waste facility (density above zero).
- Compare the share of overburdened and other neighborhoods with a facility, and their average density.
- Split neighborhoods into five groups by % people of color and compare.
- Compare within each county and make bar charts.
bg["any"] = bg["SOLIDWASTE_BG"] > 0
print(bg.groupby("is_obc")["any"].mean())                 # share of neighborhoods with a facility
print(bg.groupby(pd.qcut(bg.MINORITY_PCT, 5))["any"].mean())
New skills: true/false columns, group shares, and comparing across categories.
Data and methods
Data sources
- NJDEP EJ Law data (version effective January 31 – July 30, 2024), "Solid Waste Facilities" (sites per square mile).
The analysis was done in Python with public data. The full code, its data, and every figure it produces are in the code project below.
References
- New Jersey Department of Environmental Protection. (2024). Environmental Justice (EJ) Law Combined Stressor Summary 20240131 to 20240730 [Data set]. https://www.arcgis.com/home/item.html?id=ec82e4d006c64553b7712abcbe36e34b
- New Jersey Legislature. (2020). P.L.2020, c.92. https://pub.njleg.gov/bills/2020/PL20/92_.PDF