
Five Years Left: Can New Jersey Replace Its Lead Pipes by 2031?
The deadline
In July 2021, New Jersey required every water utility to replace all lead service lines, the pipes connecting water mains to homes, within ten years, by July 2031 (New Jersey Legislature, 2021). The federal Lead and Copper Rule Improvements, finalized in October 2024, set a similar ten-year national requirement (U.S. EPA, n.d.-a). With about five years left, how big is the remaining job, and who is most affected?
Newark showed it can be done quickly. After lead levels in its water spiked, the city replaced more than 20,000 lead service lines in about two years at no direct cost to homeowners (WHYY, 2021). Other systems face harder math.
What we know about New Jersey’s pipes
National data improved in late 2025, when EPA released inventories reported by water systems. EPA’s revised estimate was about 4 million lead service lines nationwide, down from earlier survey-based estimates of about 9 million. New Jersey was among the states where roughly 5% to 13% of reported lines were lead or galvanized pipe needing replacement (Environmental Policy Innovation Center, 2026).
For system-level detail, I used EPA’s 7th Drinking Water Infrastructure Needs Survey (conducted in 2021–22 and published in 2023), which collected service line counts from a sample of larger systems (U.S. EPA, n.d.-b). It includes 41 New Jersey systems with about 1.32 million service lines:
| Material | Lines | Share |
|---|---|---|
| Lead | 95,189 | 7% |
| Galvanized, requiring replacement | 32,007 | 2% |
| Unknown | 713,077 | 54% |
| Not lead | 477,545 | 36% |
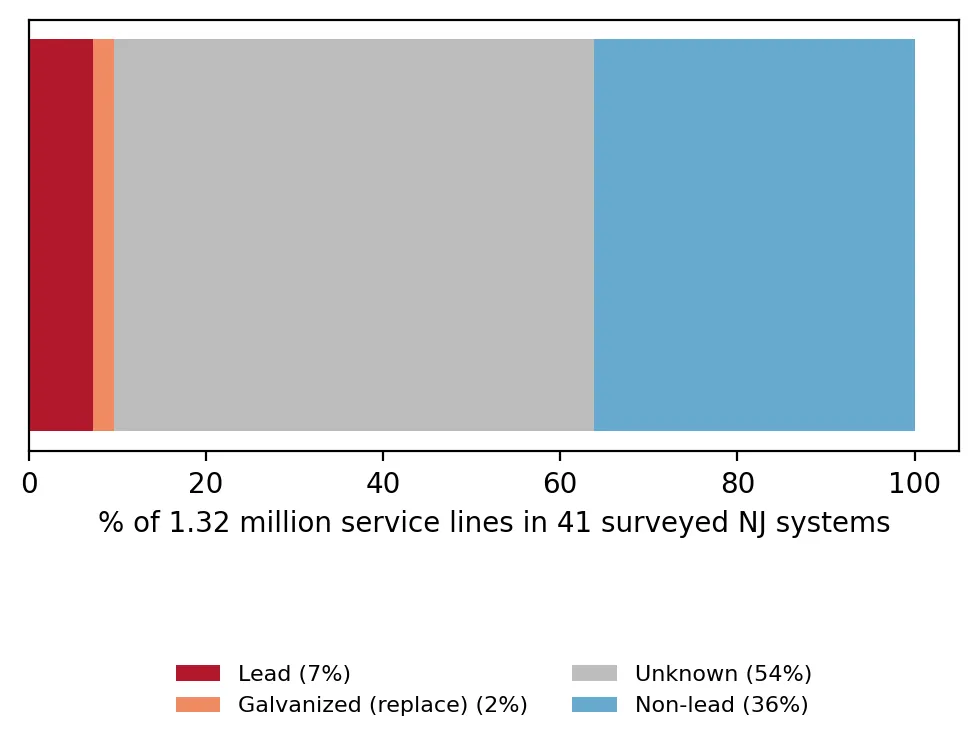 Figure 2. More than half of surveyed service lines have an unknown material.
The biggest number is unknown. At the time of the survey, utilities did not know what more than half their service lines were made of. Some will turn out to be lead.
The systems with the most lines needing replacement were Newark (24,000 lead, the city’s pre-replacement inventory), Trenton Water Works (23,165), Veolia’s Hackensack system (18,687 lead), New Jersey American Water’s Raritan system (about 10,300 lead or galvanized), and East Orange (9,500).
Who is affected?
I calculated the share of each system’s service-area residents living in an overburdened community (OBC) and compared it with the share of lines needing replacement.
Pooled together, systems where at least 75% of residents live in OBCs had 16.8% of their lines needing replacement, compared with 4.9% for other systems, more than three times higher.
But when each system is treated as one data point, the relationship is weaker. The rank correlation is ρ = 0.22, and a bootstrap 95% confidence interval runs from −0.14 to 0.55, which includes zero.
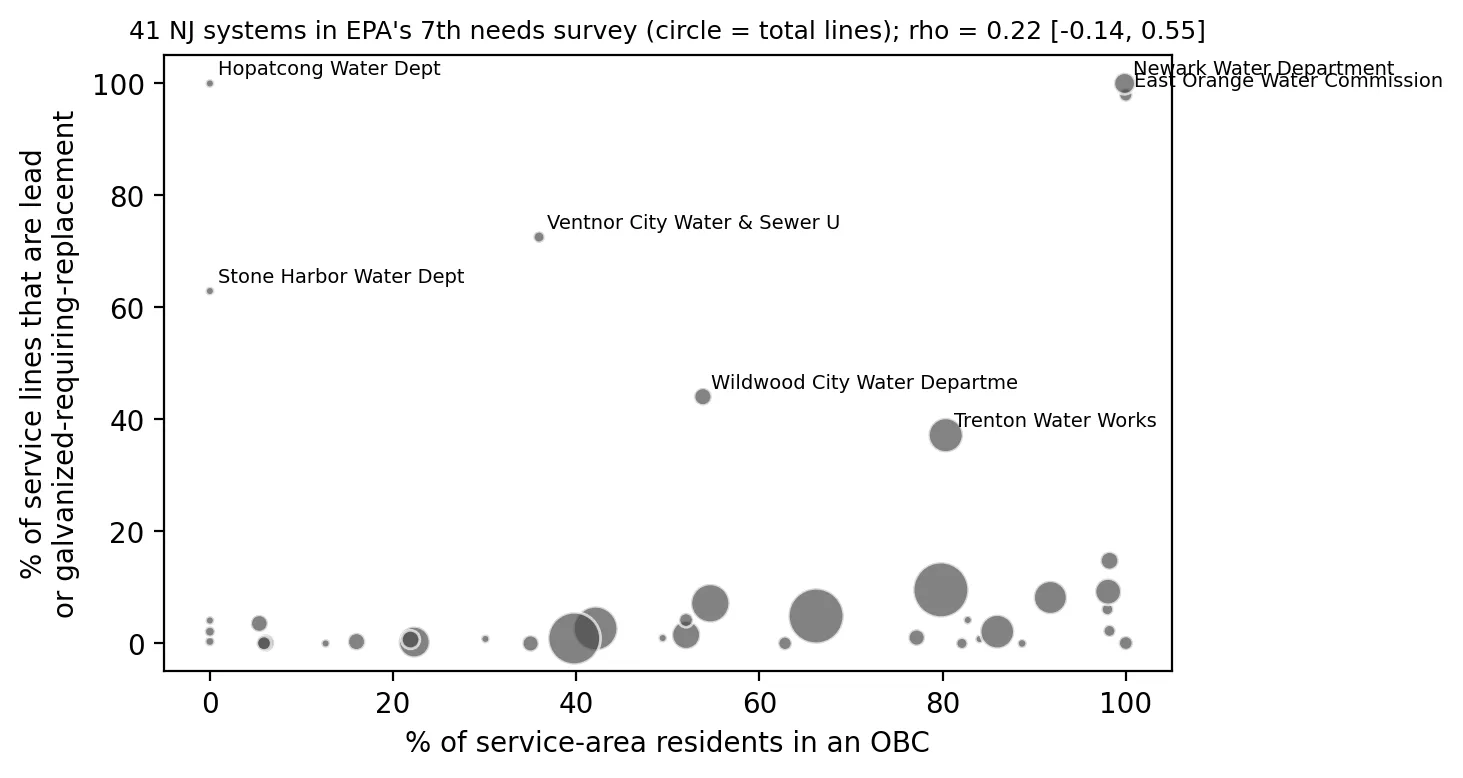 Figure 1. Across water systems, the link between overburdened service areas and lead lines is weak, driven by a few older cities.
Why the difference? The pooled number is dominated by a few large urban systems (Newark, Trenton, East Orange) that combine very high lead counts with mostly overburdened service areas. Many other systems serving OBCs report few lead lines, or mostly “unknown.” So the burden is highly concentrated in specific older cities rather than spread evenly across all systems that serve overburdened communities.
Trenton’s math
Trenton Water Works illustrates the challenge. As of August 2025, about 20,000 properties in its system still had known lead service lines (Community News, 2025). Its fifth replacement phase, financed in June 2025 through the New Jersey Water Bank, covers about 1,500 lines (New Jersey Infrastructure Bank, 2025). To finish by July 2031, Trenton would need to replace roughly 3,350 lines per year, more than twice the size of a typical phase each year, every year, while also identifying unknown lines. At a few thousand to ten thousand dollars per line, funding and construction capacity, not just will, are the limits.
This matters for health. In the most recent state report, Trenton had the highest rate of elevated blood lead among large New Jersey cities (my childhood lead post).
Limitations
- Old survey, sample of systems. The 7th needs survey reflects inventories from 2021–22 and covers only 41 New Jersey systems. Newark’s entry appears to reflect its original inventory, most of which had been replaced by 2021.
- Unknowns. With over half of lines unknown, true lead counts could be much higher.
- Small sample. With 40 matched systems, correlation estimates are uncertain. That is exactly why the bootstrap interval is wide.
Code project (Level 4): bootstrap confidence intervals
Goal: Describe New Jersey’s service line inventory and test whether lead-line share relates to OBC share, with honest uncertainty.
Data: EPA 7th DWINSA system-level service line counts for New Jersey (via a public ArcGIS layer that joins them to EPA service-area boundaries); NJDEP water service areas; NJDEP OBC list in effect on the cutoff date.
Method:
- Total lead, galvanized, unknown, and all lines.
- Estimate each system’s OBC share from block groups in its service area.
- Compute Spearman’s ρ, then bootstrap: resample the systems with replacement 5,000 times, recompute ρ each time, and take the 2.5th and 97.5th percentiles as a 95% interval.
- Compare with the pooled ratio, and project Trenton’s required pace.
boot = [spearmanr(*d.sample(len(d), replace=True)[["obc_share", "share_lead_grr"]].T.values)[0]
        for _ in range(5000)]
lo, hi = np.percentile(boot, [2.5, 97.5])
New skills: bootstrapping, and understanding why a pooled ratio and a unit-level correlation can tell different stories.
Full scripts: code/00_download.py, code/analysis.py.
Data and methods
Data sources
- EPA 7th DWINSA system-level service line counts for New Jersey (via a public ArcGIS layer that joins them to EPA service-area boundaries); NJDEP water service areas; NJDEP OBC list in effect on the cutoff date.
The analysis was done in Python with public data. The full code, its data, and every figure it produces are in the code project below.
References
- Community News. (2025). Trenton Water Works begins new phase of lead pipe replacements. https://communitynews.org/?p=359452
- Environmental Policy Innovation Center. (2026, January 22). What best available data tells us about lead service lines. https://www.policyinnovation.org/insights/what-best-available-data-tells-us-about-lead-service-lines
- New Jersey Infrastructure Bank. (2025, June 24). Trenton Water Works lead service line replacement Phase 5. https://www.njib.gov/news/trenton-water-works-lsl-replacement-phase-5-6827956e89894
- New Jersey Legislature. (2021). P.L.2021, c.183. https://pub.njleg.gov/bills/2020/PL21/183_.PDF
- U.S. Environmental Protection Agency. (n.d.-a). Lead and Copper Rule Improvements. https://www.epa.gov/ground-water-and-drinking-water/lead-and-copper-rule-improvements
- U.S. Environmental Protection Agency. (n.d.-b). EPA's 7th Drinking Water Infrastructure Needs Survey and Assessment. https://www.epa.gov/dwsrf/epas-7th-drinking-water-infrastructure-needs-survey-and-assessment
- Earthjustice. (n.d.). Drinking water: PWS with lead service lines [ArcGIS layer compiling EPA DWINSA service line data]. https://www.arcgis.com/home/item.html?id=b8ab8325949f446b8cd00c206bd2800f
- WHYY. (2021, November 7). After drinking water crisis, Newark is winning war on lead. https://whyy.org/articles/after-drinking-water-crisis-newark-is-winning-war-on-lead