
Did the Heat Grants Reach the Hottest Places?
The grants
In July 2025, the New Jersey Board of Public Utilities (NJBPU) launched a $5 million Urban Heat Island Mitigation Program for overburdened municipalities (my tree canopy post). On March 18, 2026, it announced the winners: 26 projects chosen from 43 applications (NJBPU, 2026). The largest awards went to Trenton’s “Tree Arteries” project and Camden’s Farnham Park redevelopment ($1 million each), followed by resilience hubs and cool-roof projects in Trenton, Pennsauken, Newark, and Elizabeth ($500,000 each), plus 20 community projects of $50,000 each.
After July’s deadly heat wave (my July heat wave post), a natural question is whether the money went where heat vulnerability is greatest. This post compares the awards with the heat vulnerability index from my heat vulnerability post and the hot spots from that July heat wave post.
One important caveat up front: this was a competitive program. NJBPU funded the projects that municipalities and nonprofits proposed and that scored well. A city that didn’t apply couldn’t be funded. Comparing awards with need doesn’t mean NJBPU made mistakes; it shows where needs remain unmet.
Awards by municipality
| Municipality | Awards | Total |
|---|---|---|
| Trenton | 7 projects | $1,750,000 |
| Camden | 3 | $1,100,000 |
| Newark | 8 | $850,000 |
| Elizabeth (incl. a shared Elizabeth–Roselle project) | 2 | $550,000 |
| Pennsauken | 1 | $500,000 |
| Paterson, Atlantic City, Lakewood, Egg Harbor City | 1 each | $50,000 each |
One $50,000 project (Isles, Inc., “cooling benches”) did not list a municipality and is excluded from municipal totals.
Findings
Funded towns contain about half of the most vulnerable residents
The nine funded municipalities are home to 49% of the residents living in the state’s most heat-vulnerable block groups (the top 10% of my heat vulnerability index), and 29% of residents in heat hot spots. Across the 348 municipalities with any overburdened community residents, award dollars were positively but modestly related to the number of highly vulnerable residents (Spearman’s ρ = 0.30).
Per-resident funding varies enormously
| Municipality | Award | Residents in top-10% vulnerability block groups | Share of awards | Share of most-vulnerable residents |
|---|---|---|---|---|
| Newark | $850,000 | 134,920 | 17% | 15% |
| Paterson | $50,000 | 97,738 | 1% | 11% |
| Elizabeth | $550,000 | 87,338 | 11% | 10% |
| Trenton | $1,750,000 | 44,038 | 35% | 5% |
| Camden | $1,100,000 | 30,670 | 22% | 3% |
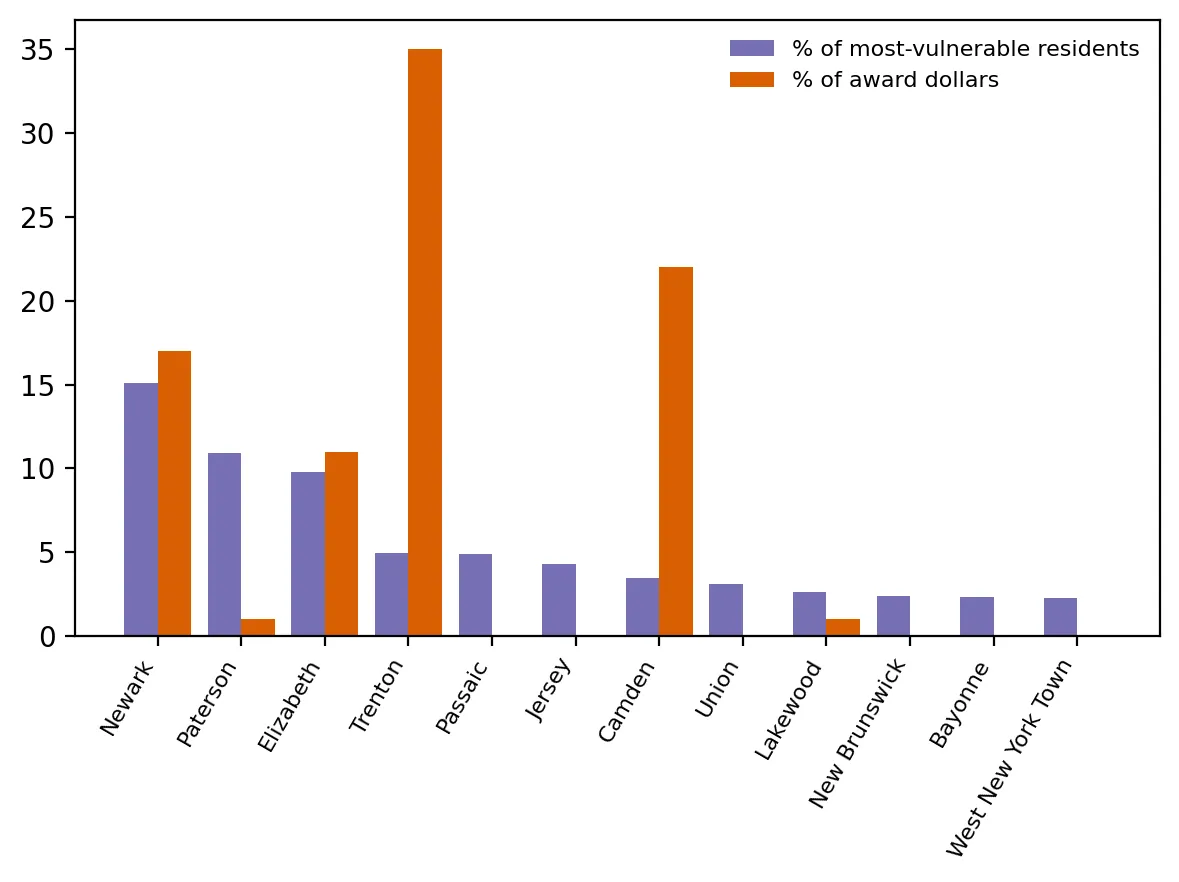 Figure 2. Award dollars did not track need: Trenton and Camden received far more than their share, while Paterson and others received little or nothing.
Newark and Elizabeth received roughly their “proportional” share. Trenton and Camden received much more than their share of highly vulnerable residents, reflecting large, ready-to-build projects. Paterson, with the second-largest population of highly vulnerable residents in the state, received one $50,000 grant.
Unfunded hot spots
Several cities with large concentrations of highly vulnerable residents received no awards: Passaic (about 43,000 residents in top-10% block groups), Jersey City (38,000), Union City (28,000), New Brunswick (21,000), Bayonne (21,000), West New York (20,000), North Bergen (19,000), and Perth Amboy (17,000). Most of them sit inside the large Hudson–Essex–Passaic hot spot identified in my July heat wave post.
A counterfactual
If the same $5 million had been divided in proportion to each municipality’s number of highly vulnerable residents, Newark would have received about $755,000, Paterson $547,000, Elizabeth $489,000, Trenton $246,000, Passaic $243,000, Jersey City $214,000, and Camden $172,000. The concentration curve (Figure 1) shows the actual awards departing from that proportional line.
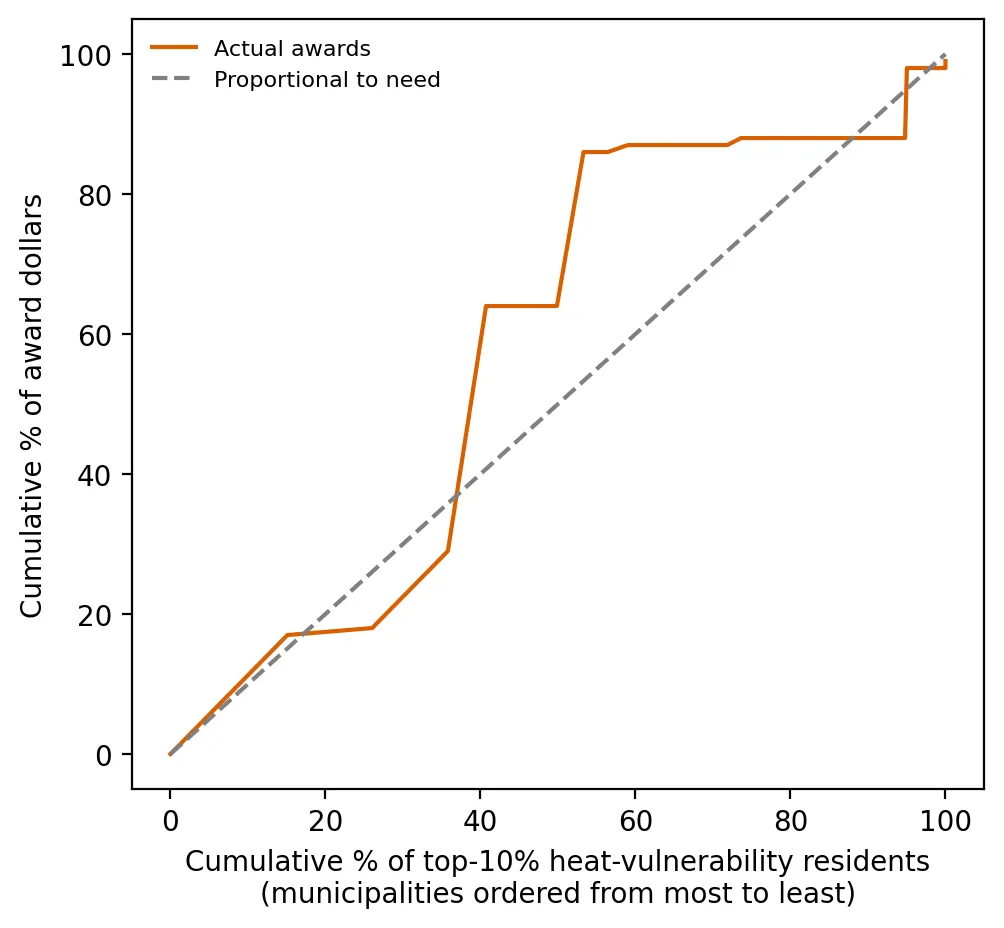 Figure 1. Actual heat grant awards depart from a distribution proportional to need, with dollars concentrated in a few municipalities.
What this suggests
A $5 million pilot can’t cool New Jersey, and funding strong, shovel-ready projects is a reasonable way to start. But for future rounds, the data point to a few options:
- Targeted outreach and technical help for high-need cities that didn’t apply or didn’t win, so their capacity to write competitive applications isn’t the deciding factor.
- A needs-based component, such as setting aside part of the funding for the most vulnerable areas based on a transparent index.
- Regional projects across the large Hudson–Essex–Passaic hot spot, where the need crosses municipal lines.
Limitations
- Competitive, not formula-based. I don’t know which municipalities applied or how projects were scored.
- Project location versus municipality. Some projects serve specific neighborhoods. Assigning the whole award to the municipality is a simplification.
- My index is one of many. A different definition of vulnerability would shift the comparison somewhat (though my heat vulnerability post showed the rankings were robust).
Code project (Level 5): evaluating an allocation
Goal: Compare where heat-island grant dollars went with where heat vulnerability is concentrated.
Data: NJBPU award list (entered from the March 18, 2026 press release into code/awards.csv); heat vulnerability index from my heat vulnerability post; hot-spot classification from my July heat wave post; NJDEP municipal boundaries and OBC data.
Method:
- Aggregate block-group vulnerability and hot-spot residents to municipalities with a spatial join.
- Merge award totals and compute shares, dollars per vulnerable resident, and a rank correlation (including zeros for unfunded towns).
- Draw a concentration curve: order municipalities by need, then plot cumulative need against cumulative dollars.
- Build a needs-proportional counterfactual allocation.
e = towns.sort_values("top_hvi_pop", ascending=False)
x = np.cumsum(e.top_hvi_pop) / e.top_hvi_pop.sum()
y = np.cumsum(e.award) / e.award.sum()        # 45° line = perfectly proportional to need
New skills: policy evaluation with data, counterfactual reasoning, and turning a press release into a dataset.
Data and methods
Data sources
- NJBPU award list (entered from the March 18, 2026 press release into data/awards.csv); heat vulnerability index from my heat vulnerability post; hot-spot classification from my July heat wave post; NJDEP municipal boundaries and OBC data.
The analysis was done in Python with public data. The full code, its data, and every figure it produces are in the code project below.
References
- New Jersey Board of Public Utilities. (2025, July 17). NJ announces $5 million grant program to combat deadly urban heat [Press release]. https://www.nj.gov/bpu/newsroom/2025/approved/20250717.html
- New Jersey Board of Public Utilities. (2026, March 18). Urban Heat Island Mitigation Program awards [Press release]. https://www.nj.gov/bpu/newsroom/2026/approved/20260318.html
- New Jersey Department of Environmental Protection. (2026). Environmental Justice (EJ) Law Combined Stressor Summary (Current) [Data set]. https://www.arcgis.com/home/item.html?id=8f1eeb5074d147af8ab3e5e5a4f72d2b
- U.S. Geological Survey. (2026). Landsat 8–9 Collection 2 Level-2 [Data set], via Microsoft Planetary Computer. https://planetarycomputer.microsoft.com/dataset/landsat-c2-l2