
Licensed to Pollute: Who Lives Among New Jersey's Permitted Air Pollution Sources?
Where air pollution comes from
Some of New Jersey’s worst air days come from far away. In June 2023, smoke from Canadian wildfires turned the sky orange (OPB, 2023). But day to day, a lot of what people breathe comes from sources close to home, including facilities that hold air pollution permits from NJDEP, from large power plants and factories to smaller sources. A permit sets limits on what a facility may release, but a permitted facility still emits pollution. That’s why “major source of air pollution” is the first type of facility listed in New Jersey’s Environmental Justice Law (New Jersey Legislature, 2020).
When many permitted facilities cluster together, their emissions add up. This post asks: which neighborhoods have the most permitted air pollution sources around them?
Data
NJDEP’s EJ data include a “Permitted Air Sites” measure for every neighborhood (census block group): the number of facilities with NJDEP air pollution permits per square mile (NJDEP, 2024). I used the version in effect in October 2024 and compared 6,526 populated neighborhoods.
Findings
About three times as many permitted air sources
| Overburdened communities | Other neighborhoods | |
|---|---|---|
| Median permitted air sites per square mile | 2.23 | 0.77 |
| Residents living in NJ’s densest fifth of neighborhoods for air permits | 32% | 3% |
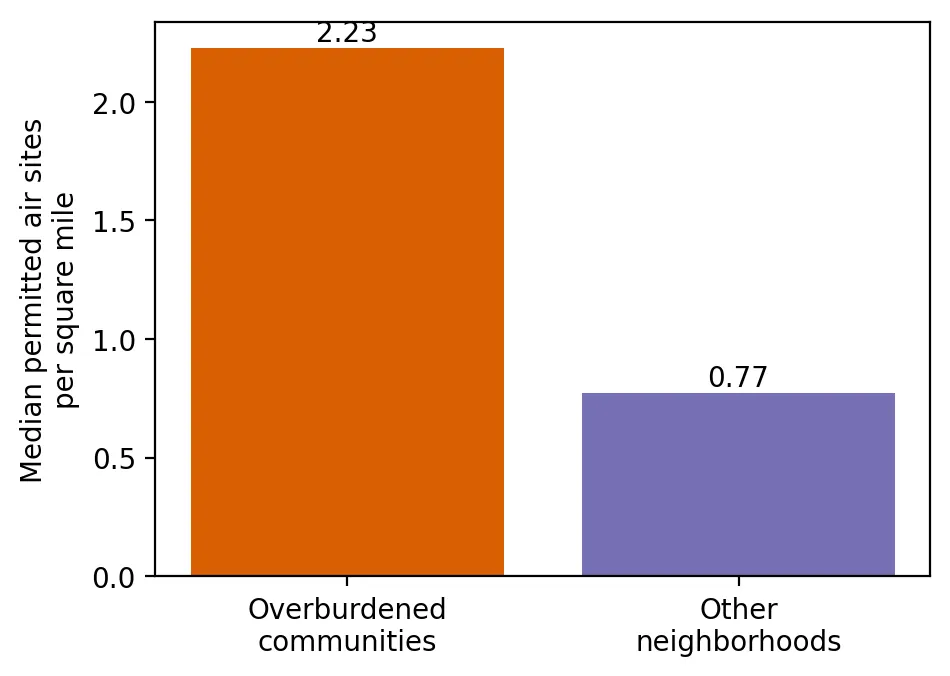 Figure 2. The typical overburdened community has about 2.9 times as many permitted air pollution sources per square mile.
The typical overburdened community has about 2.9 times as many permitted air pollution sources per square mile as the typical other neighborhood. One in three residents of overburdened communities lives in the state’s densest fifth of neighborhoods for air permits, compared with 3% of other residents, a roughly tenfold difference.
The densest fifth of neighborhoods are home to about 1.75 million people, and 91% of those neighborhoods are overburdened communities.
A steep climb with the share of people of color
| Neighborhoods grouped by % people of color | Avg. % people of color | Median air sites per sq. mile | % in NJ’s densest fifth |
|---|---|---|---|
| Fewest | 8% | 0.53 | 1% |
| 2nd | 23% | 0.84 | 4% |
| Middle | 41% | 1.15 | 12% |
| 4th | 66% | 2.17 | 31% |
| Most | 92% | 3.13 | 51% |
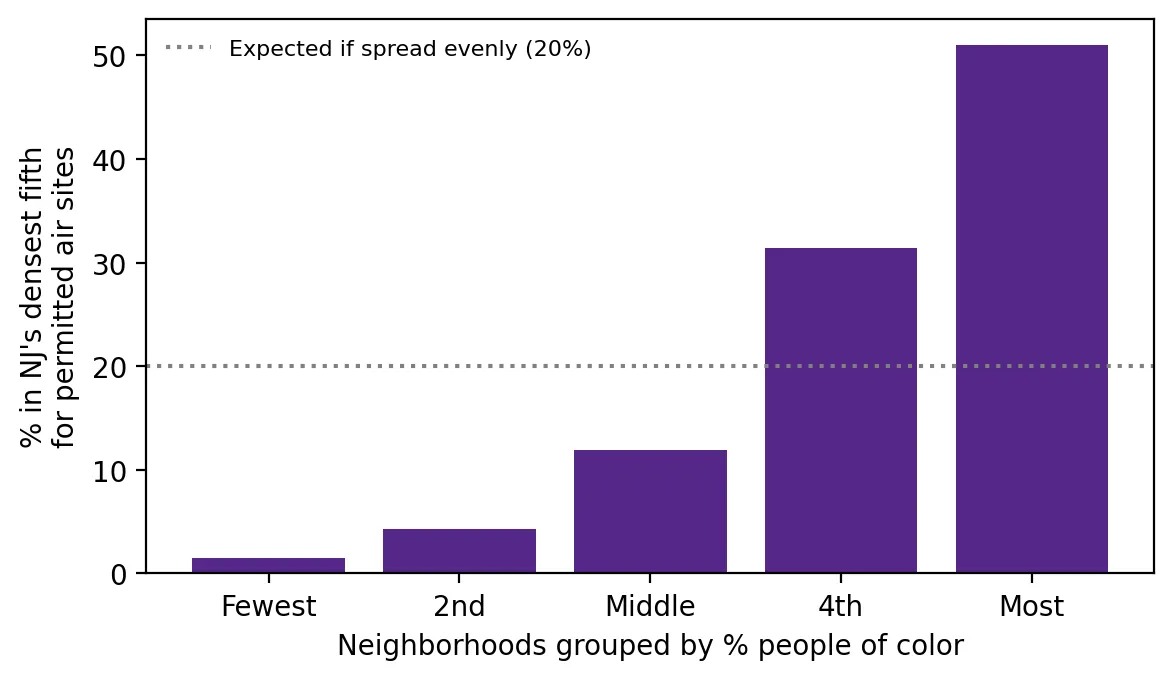 Figure 1. Permitted air pollution sources are packed most densely into neighborhoods with the most people of color.
If permitted sources were spread evenly, about 20% of every kind of neighborhood would be in the densest fifth. Instead, it’s 1% of the least diverse neighborhoods and 51%, more than half, of the most diverse.
In 20 of 21 counties
In 20 of New Jersey’s 21 counties, the typical overburdened neighborhood has more permitted air pollution sources per square mile than the typical other neighborhood in the same county.
Why this matters
Every air permit is approved one at a time, and each facility may meet its own limits. But neighbors breathe the total. This analysis shows that permitted air pollution sources are packed most densely into overburdened communities and communities of color. That cumulative pattern is exactly what New Jersey’s Environmental Justice Law asks regulators to consider before approving more.
Limitations
- Counts, not emissions. A small facility and a large power plant each count as one site.
- Permits change. Facilities open, close, and change permits over time.
- Neighborhood boundaries. A facility just across a boundary counts for the neighborhood it’s in, even if its neighbors are next door.
Code project (Level 0): who carries the most?
Goal: Compare how densely permitted air pollution sources are packed around overburdened and other neighborhoods.
Data: NJDEP EJ Law data (version effective July 31, 2024 – January 30, 2025), “Permitted Air Sites” (sites per square mile).
Steps:
- Load the data and keep neighborhoods with residents.
- Compare medians and averages for overburdened and other neighborhoods.
- Find the densest 20% of neighborhoods and how many are overburdened communities.
- Split neighborhoods into five groups by % people of color and compare.
- Compare within each county and make bar charts.
dense = bg["AIRSITES_BG"] >= bg["AIRSITES_BG"].quantile(0.8)    # densest 20%
print(bg.is_obc[dense].mean())                                 # share that are OBCs
print(bg.groupby("is_obc")["AIRSITES_BG"].median())
New skills: percentile cutoffs, ratios, and checking a pattern county by county.
Data and methods
Data sources
- NJDEP EJ Law data (version effective July 31, 2024 – January 30, 2025), "Permitted Air Sites" (sites per square mile).
The analysis was done in Python with public data. The full code, its data, and every figure it produces are in the code project below.
References
- New Jersey Department of Environmental Protection. (2024). Environmental Justice (EJ) Law Combined Stressor Summary 20240731 – 20250130 [Data set]. https://www.arcgis.com/home/item.html?id=12c559e017264e7ba621669bf8f948d7
- New Jersey Legislature. (2020). P.L.2020, c.92. https://pub.njleg.gov/bills/2020/PL20/92_.PDF
- OPB. (2023, June 7). Photos: Extreme Canadian wildfire smoke shrouds parts of US. https://www.opb.org/article/2023/06/07/canada-wildfire-smoke-photos