
Burning Trash Next Door: Who Lives Near New Jersey's Incinerators?
Where does the trash go?
The holidays are the season of extra trash: wrapping paper, packaging, and leftovers. Some of New Jersey’s garbage doesn’t go to a landfill. It gets burned. The state has four large trash incinerators, also called “resource recovery” or “waste-to-energy” plants, which burn garbage and use the heat to make electricity.
Burning trash releases air pollutants such as fine particles, nitrogen oxides, and metals, and it brings a steady stream of garbage trucks. That’s why New Jersey’s 2020 Environmental Justice Law lists “resource recovery facility or incinerator” as one of the eight types of facilities that need extra review before they can be built or expanded in an overburdened community (New Jersey Legislature, 2020).
In the introduction, I showed that overburdened communities carry more of nearly every pollution burden NJDEP measures. This post looks at one specific type of polluter: who lives next to New Jersey’s incinerators?
Data
- Incinerators: the U.S. Energy Information Administration’s annual survey of power plants (Form EIA-860) for 2023, which lists every plant’s location and fuel (U.S. EIA, 2024). I used the copy that was online in November 2024. Four New Jersey plants burn municipal solid waste.
- Neighborhoods: NJDEP’s overburdened community data (version in effect from July 31, 2024), with population, race, and income for every block group (NJDEP, 2024).
| Incinerator | City | Electric capacity |
|---|---|---|
| Covanta Essex Company | Newark | 69.8 MW |
| Union County Resource Recovery | Rahway | 45.0 MW |
| Camden Resource Recovery Facility | Camden | 35.0 MW |
| Wheelabrator Gloucester | Westville | 14.0 MW |
Findings
Almost everyone living next to an incinerator lives in an overburdened community
| Residents | % living in an overburdened community | % people of color | % low-income | |
|---|---|---|---|---|
| Within 1 mile of an incinerator | 47,044 | 94% | 74% | 41% |
| Within 3 miles | 507,114 | 83% | 65% | 33% |
| All of New Jersey | 9,255,437 | 55% | 47% | 22% |
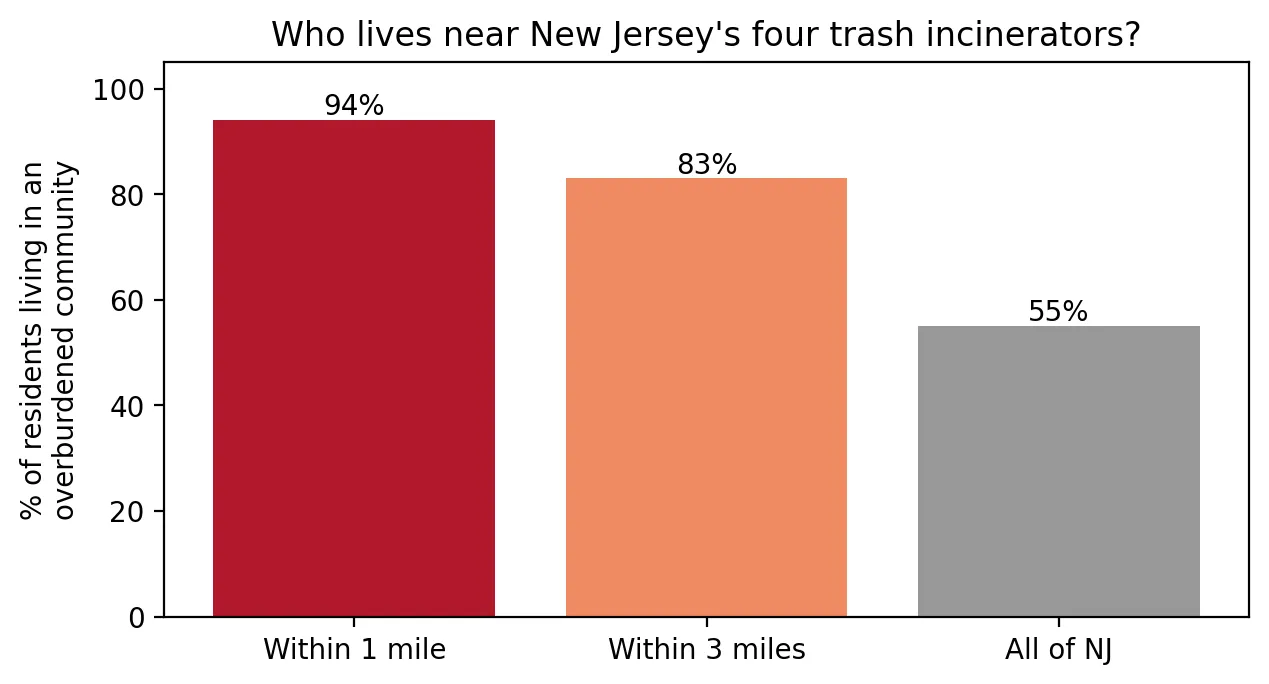 Figure 1. Almost everyone living within a mile of a New Jersey trash incinerator lives in an overburdened community.
Of the people living within a mile of an incinerator, 94% live in an overburdened community, compared with 55% of all New Jerseyans. Nearby residents are much more likely to be people of color (74% vs. 47%) and almost twice as likely to be low-income (41% vs. 22%).
Newark’s incinerator is the extreme case
| Incinerator | Residents within 3 miles | % in overburdened communities |
|---|---|---|
| Covanta Essex (Newark) | 227,225 | 99% |
| Union County (Rahway) | 141,422 | 85% |
| Camden | 102,473 | 63% |
| Wheelabrator Gloucester (Westville) | 65,014 | 42% |
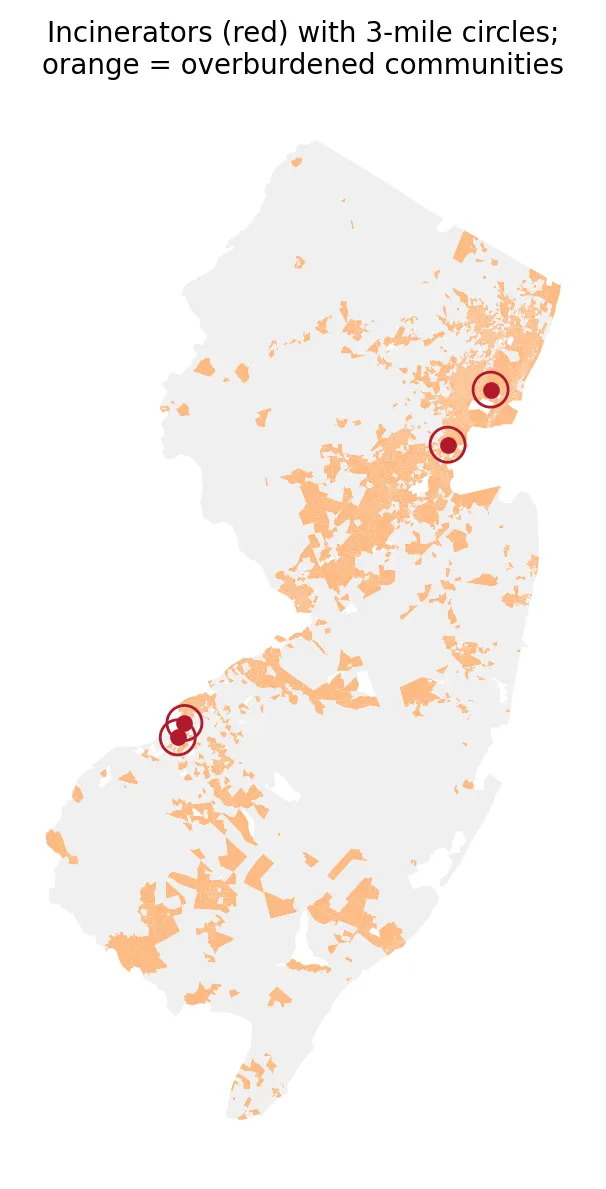 Figure 2. New Jersey’s four trash incinerators, with 3-mile circles, sit in or beside overburdened communities.
The Newark incinerator, the largest of the four by electric capacity, sits in the Ironbound area. 99% of the 227,000 people within three miles live in overburdened communities. Even the incinerator with the lowest share, in Westville, has more low-income neighbors (31%) than the state average.
What this shows
Trash from many towns is trucked to a handful of places to be burned. Those places are overwhelmingly communities of color and low-income communities. This is exactly the kind of pattern the Environmental Justice Law was written to address. The 1987 Toxic Wastes and Race report found that race predicted where hazardous waste facilities were located nationwide, and New Jersey’s incinerators fit that pattern today.
Limitations
- Distance is not exposure. Wind, stack height, and pollution controls affect who actually breathes incinerator emissions.
- Circles use block group center points, so a neighborhood counts as “within 1 mile” if its center is.
- Camden’s 3-mile circle reaches into Philadelphia, and those residents aren’t counted.
- Other waste facilities, like transfer stations and landfills, aren’t included here.
Code project (Level 0): who lives inside the circle?
Goal: Find New Jersey’s trash incinerators and describe who lives nearby.
Data: EIA-860 2023 plant and generator files (New Jersey rows); NJDEP overburdened community data (version effective July 31, 2024).
Steps:
- Filter the generator list to plants burning municipal solid waste (
MSW). - Turn plant latitude/longitude into map points.
- Draw 1-mile and 3-mile circles (
buffer) around each plant. - Add up residents whose neighborhood center falls inside, and the share in overburdened communities.
- Compare with the whole state and make a bar chart and a map.
inc = plants[plants["Plant Code"].isin(msw_plants)]
circles = inc.buffer(1 * 5280).union_all()           # 1 mile = 5,280 feet
near = neighborhoods[neighborhoods.within(circles)]
print(near.TOTALPOP[near.is_obc].sum() / near.TOTALPOP.sum())
New skills: filtering by category, making map points, and drawing circles to find who lives nearby.
Data and methods
Data sources
- EIA-860 2023 plant and generator files (New Jersey rows); NJDEP overburdened community data (version effective July 31, 2024).
The analysis was done in Python with public data. The full code, its data, and every figure it produces are in the code project below.
References
- Commission for Racial Justice, United Church of Christ. (1987). Toxic wastes and race in the United States. https://www.ucc.org/wp-content/uploads/2020/12/ToxicWastesRace.pdf
- New Jersey Department of Environmental Protection. (2024). Environmental Justice (EJ) Law Combined Stressor Summary 20240731 – 20250130 [Data set]. https://www.arcgis.com/home/item.html?id=12c559e017264e7ba621669bf8f948d7
- New Jersey Legislature. (2020). P.L.2020, c.92. https://pub.njleg.gov/bills/2020/PL20/92_.PDF
- U.S. Energy Information Administration. (2024). Form EIA-860 detailed data, 2023 [Data set; archived copy of November 16, 2024]. https://www.eia.gov/electricity/data/eia860/ (archive: https://web.archive.org/web/20241116185137/https://www.eia.gov/electricity/data/eia860/xls/eia8602023.zip)