
The Soot Standard Under Review: Where New Jersey Stands on Fine Particle Pollution
The news
On March 11, 2025, the U.S. EPA announced a long list of regulations it planned to reconsider. One item was the national air quality standard for fine particulate matter (PM2.5) that EPA had tightened just a year earlier (U.S. EPA, 2025a). In February 2024, EPA lowered the annual PM2.5 standard from 12.0 to 9.0 micrograms per cubic meter (µg/m³), the first change in more than a decade (U.S. EPA, 2024).
Why does this matter for New Jersey? Fine particles are about 1/30th the width of a human hair, small enough to travel deep into the lungs and even into the bloodstream. Exposure is linked to heart attacks, strokes, asthma, and premature death (U.S. EPA, n.d.). Unlike ozone (see my last post), much fine particle pollution comes from local sources such as diesel trucks, ports, highways, and industrial facilities, so levels can differ from one neighborhood to the next.
How compliance is measured
A monitor’s PM2.5 design value is the average of its annual means over three years. If that number is above 9.0 µg/m³, the area does not meet the standard. A separate 24-hour standard of 35 µg/m³ applies to the worst days (the 98th percentile of daily values, averaged over three years).
What New Jersey’s monitors show (2022–2024)
I calculated approximate design values for the 19 New Jersey monitors with complete data for 2022, 2023, and 2024.
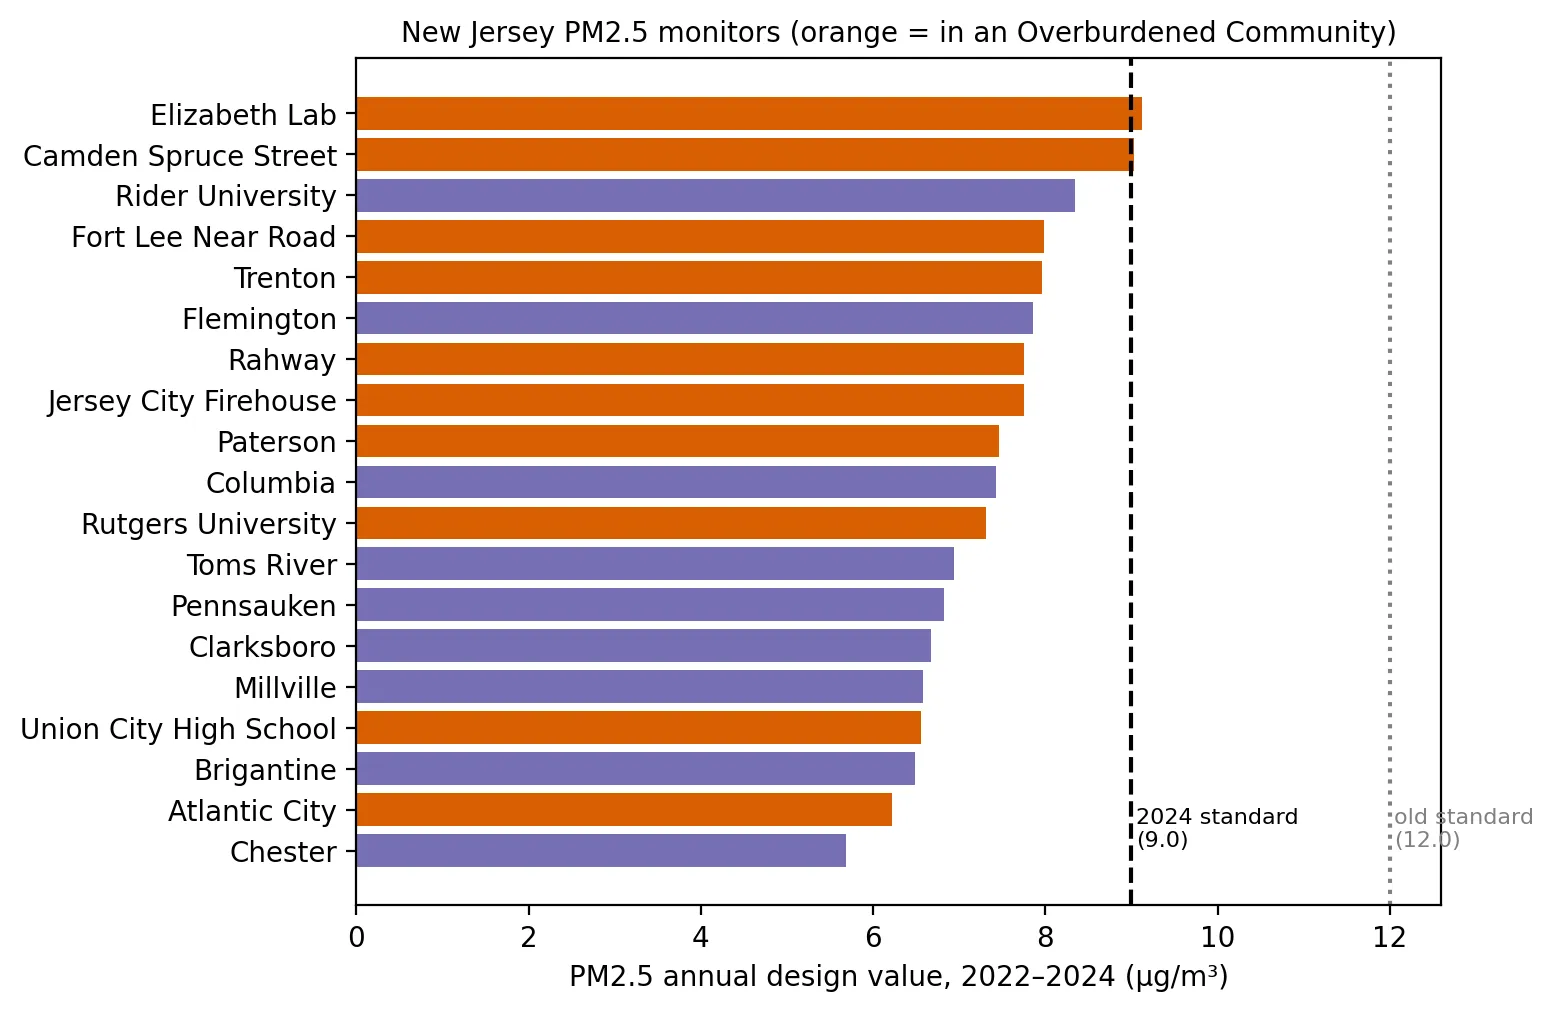 Figure 1. Two New Jersey PM2.5 monitors, both in overburdened communities, are at or above the 2024 standard of 9.0 micrograms per cubic meter.
Two monitors are at or above the new standard. Elizabeth Lab in Union County (9.1 µg/m³) is above 9.0. Camden Spruce Street (9.0) sits right at the line. Both are in overburdened communities, and both are near major pollution sources: the Elizabeth monitor sits beside the New Jersey Turnpike near Port Newark–Elizabeth, and the Camden site is near the city’s industrial waterfront. Under the old 12.0 standard, every New Jersey monitor would comfortably pass. The 2024 tightening is what makes these two locations stand out.
No monitor exceeded the 24-hour standard. The highest 24-hour design value was about 22 µg/m³ (Elizabeth Lab), well below 35.
Overburdened communities have somewhat higher levels. The 10 monitors located in overburdened communities averaged 7.7 µg/m³, compared with 7.0 µg/m³ for the 9 monitors elsewhere. The difference is about 10%. The highest-reading monitors, including Elizabeth, Camden, Fort Lee Near Road, Trenton, Rahway, Jersey City, and Paterson, are almost all in urban, overburdened areas. The lowest readings came from rural and shore locations such as Chester, Brigantine, and Millville.
| Monitor | 2022–24 annual design value (µg/m³) | In an OBC? |
|---|---|---|
| Elizabeth Lab | 9.1 | Yes |
| Camden Spruce Street | 9.0 | Yes |
| Rider University | 8.3 | No |
| Fort Lee Near Road | 8.0 | Yes |
| Trenton | 8.0 | Yes |
| … | … | … |
| Chester | 5.7 | No |
Why the reconsideration matters for environmental justice
If the 9.0 standard were relaxed or delayed, the communities that would lose the most protection are the ones near monitors like Elizabeth and Camden: places close to ports, highways, and industry, where residents are mostly low-income people and people of color. A strict standard forces states to write plans to reduce pollution in exactly those areas. EPA had estimated that the 2024 standard would prevent thousands of premature deaths nationwide each year (U.S. EPA, 2024). Whether that benefit survives the reconsideration was an open question in March 2025.
Limitations
- Approximate design values. EPA’s official calculation uses detailed data completeness rules, and it can exclude “exceptional events” such as the Canadian wildfire smoke that blanketed New Jersey in June 2023. My simplified averages may differ slightly from official values. EPA also rounds design values to one decimal place, so Camden’s 9.0 might officially meet the standard.
- Preliminary 2024 data (certified after the cutoff date).
- Sparse monitors. Nineteen monitors cannot represent every neighborhood. Many overburdened communities have no monitor at all.
Code project (Level 1, step up): multi-year averages
Goal: Approximate each New Jersey monitor’s PM2.5 design value for 2022–2024.
Data: EPA AirData daily PM2.5 files (daily_88101_2022.zip, …2023.zip, …2024.zip); NJDEP OBC list in effect on the cutoff date.
Method:
- Keep New Jersey rows with 24-hour samples.
- Average co-located instruments to get one value per site per day.
- For each site and year, compute the annual mean and the 98th percentile.
- Keep sites with reasonably complete data in all three years.
- Average across the three years to get approximate design values.
- Compare with 9.0 µg/m³, then compare OBC and non-OBC monitors.
per_year = daily.groupby(["site_id", "year"])["Arithmetic Mean"].agg(["mean", lambda s: s.quantile(0.98)])
design_value = per_year.groupby("site_id")["mean"].mean()
print((design_value > 9.0).sum(), "monitors above the 2024 standard")
New skill: Working across several files and years, then aggregating in two steps (day → year → three-year average).
Data and methods
Data sources
- EPA AirData daily PM2.5 files (daily_88101_2022.zip, …2023.zip, …2024.zip); NJDEP OBC list in effect on the cutoff date.
The analysis was done in Python with public data. The full code, its data, and every figure it produces are in the code project below.
References
- U.S. Environmental Protection Agency. (n.d.). Health and environmental effects of particulate matter (PM). https://www.epa.gov/pm-pollution/health-and-environmental-effects-particulate-matter-pm
- U.S. Environmental Protection Agency. (2024). Final reconsideration of the National Ambient Air Quality Standards for particulate matter (PM). https://www.epa.gov/pm-pollution/final-reconsideration-national-ambient-air-quality-standards-particulate-matter-pm
- U.S. Environmental Protection Agency. (2025a, March 11). EPA launches biggest deregulatory action in U.S. history [Press release]. https://www.epa.gov/newsreleases/epa-launches-biggest-deregulatory-action-us-history
- U.S. Environmental Protection Agency. (2025b). AirData pre-generated data files: Daily PM2.5 FRM/FEM mass (88101), 2022–2024 [Data set]. https://aqs.epa.gov/aqsweb/airdata/download_files.html