
Superfund State: Who Lives Near New Jersey's 113 Most Hazardous Sites?
Background
In 1980, after toxic waste was discovered under homes and a school in the Love Canal neighborhood of Niagara Falls, New York, Congress created the Superfund program. It gives the U.S. EPA authority to clean up the country’s worst hazardous waste sites and to make the responsible companies pay (U.S. EPA, n.d.-a). The most serious sites go on the National Priorities List (NPL).
New Jersey has been at the center of Superfund from the beginning. When EPA published its first NPL in 1983, a New Jersey site, the Lipari Landfill in Gloucester County, ranked first in the nation. New Jersey’s history of chemical manufacturing, oil refining, and industrial dumping, packed into a small and densely populated state, left it with more NPL sites than any other state.
How many, and where?
Using EPA’s list of NPL sites, which records the date each site was proposed, listed, and deleted, I rebuilt the list exactly as it stood on April 16, 2025 (see the code project).
New Jersey led the nation with 113 final NPL sites, ahead of California (97), Pennsylvania (91), and New York (83). For a state of New Jersey’s size, that works out to about 13 sites per 1,000 square miles. Another two New Jersey sites were proposed for listing, and 38 had been deleted from the list, meaning EPA determined that no further cleanup action was needed.
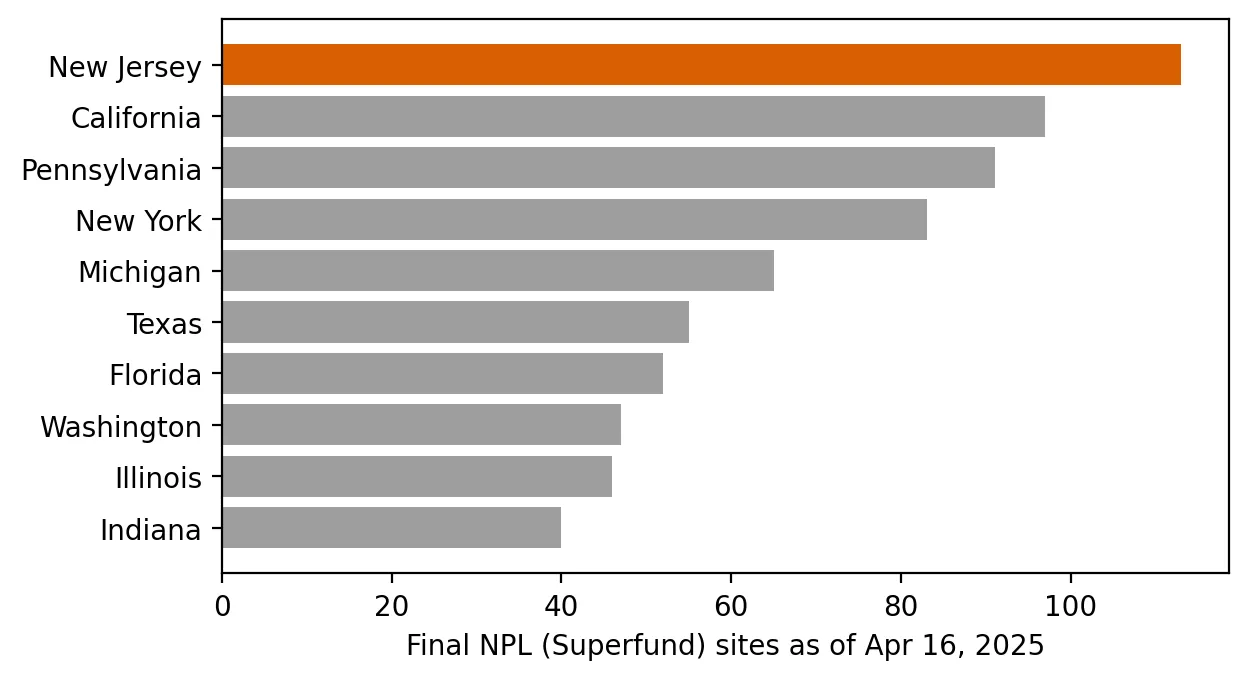 Figure 1. New Jersey has more final Superfund sites than any other state.
The sites are spread across the state, from Middlesex (14) and Burlington (11) to Morris, Camden, and Gloucester (9 each). They include landfills, chemical plants, drum-disposal sites, and contaminated groundwater plumes.
Who lives nearby?
To measure proximity, I counted the 2020 Census population living within 1 mile of a final NPL site, using population counts for about 138,000 census blocks, and split residents by whether they live in an overburdened community (OBC).
| Group | Living within 1 mile of a final NPL site |
|---|---|
| All New Jersey residents | 754,576 (8.1%) |
| Residents of overburdened communities | 592,670 (11.4%) |
| Other residents | 161,906 (4.0%) |
Residents of overburdened communities are about 2.9 times as likely as other New Jerseyans to live within a mile of a Superfund site.
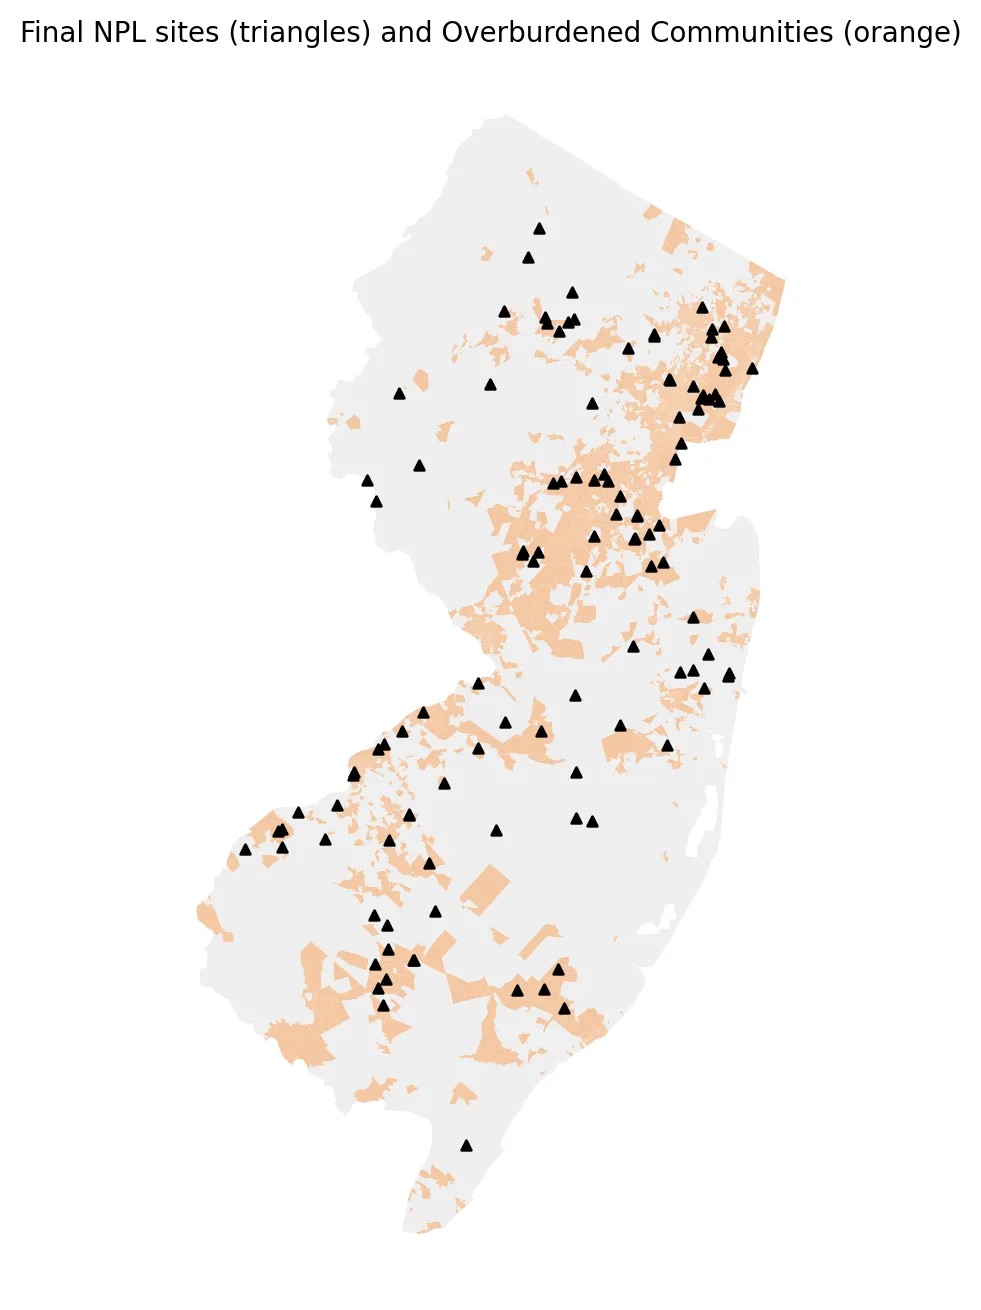 Figure 2. Superfund sites are concentrated in the same industrial corridors where many overburdened communities are located.
Why proximity matters
Living near a Superfund site does not automatically mean someone is exposed to its contamination. Exposure depends on how contaminants move, through groundwater, soil, dust, or air, and on whether cleanup has contained them. But proximity is still meaningful. Research has found that cleaning up Superfund sites improved infant health for families living nearby. Currie, Greenstone, and Moretti (2011) found that cleanups reduced the risk of congenital anomalies among babies born to mothers living within about 2 kilometers of a site. Nearby sites also affect property values, community stigma, and how long residents must live with uncertainty while cleanups drag on for decades.
Discussion
The 2.9-times disparity is large, but it should not be surprising. Superfund sites are concentrated in the old industrial corridors of northern and central New Jersey and along the Delaware River, the same places where many overburdened communities are located. The causes run in both directions. Polluting industries were often sited near working-class and immigrant neighborhoods, and contamination and industry can lower housing costs, which shapes who can afford to live nearby later. My data cannot separate those two explanations.
Limitations
- Points, not boundaries. Each site is represented by a single point, but many sites, and especially groundwater plumes, cover much larger areas.
- Proximity, not exposure. The analysis counts people nearby; it does not measure contamination in their homes or bodies.
- Status changes. Sites move through the cleanup process. These counts describe one date.
Code project (Level 1→2): rebuilding a list as of a past date
Goal: Count NPL sites as of April 16, 2025, and estimate how many people live within a mile of one.
Data: U.S. EPA, Superfund National Priorities List (NPL) Sites with Status Information (with proposed, listing, and deletion dates); 2020 Census blocks with population; NJDEP OBC list in effect on the cutoff date.
Method:
- Avoid hindsight: instead of using today’s “Status” column, mark a site as final on the cutoff date if it was listed on or before that date and not deleted by then.
- Count sites by state and county.
- Draw a 1-mile buffer around each New Jersey site and merge the buffers into one shape.
- Count census-block population inside the buffers, split by OBC status.
cut = pd.Timestamp("2025-04-16")
g["final_on_cutoff"] = (g.Listing_Date <= cut) & (g.Deletion_Date.isna() | (g.Deletion_Date > cut))
near = blocks.within(active_sites.buffer(5280).union_all())   # 5,280 ft = 1 mile (NJ State Plane, feet)
New skills: working with dates, and buffers and spatial joins, my first real geographic analysis.
Data and methods
Data sources
- U.S. EPA, *Superfund National Priorities List (NPL) Sites with Status Information* (with proposed, listing, and deletion dates); 2020 Census blocks with population; NJDEP OBC list in effect on the cutoff date.
The analysis was done in Python with public data. The full code, its data, and every figure it produces are in the code project below.
References
- Currie, J., Greenstone, M., & Moretti, E. (2011). Superfund cleanups and infant health. American Economic Review, 101(3), 435–441. https://doi.org/10.1257/aer.101.3.435
- U.S. Environmental Protection Agency. (n.d.-a). What is Superfund? https://www.epa.gov/superfund/what-superfund
- U.S. Environmental Protection Agency. (n.d.-b). Superfund: National Priorities List (NPL). https://www.epa.gov/superfund/superfund-national-priorities-list-npl
- U.S. Environmental Protection Agency. (n.d.-c). NPL site status information. https://www.epa.gov/superfund/npl-site-status-information
- U.S. Environmental Protection Agency. (2025). Superfund National Priorities List (NPL) sites with status information [Data set]. https://www.arcgis.com/home/item.html?id=c2b7cdff579c41bbba4898400aa38815
- U.S. Census Bureau. (2021). TIGER/Line shapefiles: 2020 tabulation blocks, New Jersey [Data set]. https://www2.census.gov/geo/tiger/TIGER2020/TABBLOCK20/