
Hottest in the City: What Satellites Show About Heat in New Jersey's Towns
A record-setting start to summer
Summer 2025 arrived with a dangerous heat wave. On June 24, 2025, Newark reached 103°F, tying its hottest June day on record and smashing the date’s previous record of 97°F, set in 1966 (Patch, 2025; New Jersey 101.5, 2025). Overnight lows stayed in the mid-80s, giving people little relief.
Heat waves do not hit every neighborhood equally. Cities are often hotter than their surroundings, a pattern called the urban heat island. Pavement, rooftops, and dark surfaces absorb sunlight and release heat, while trees and vegetation cool the air through shade and evaporation (U.S. EPA, n.d.). In a 2024 analysis of 65 U.S. cities, Climate Central estimated that Newark had one of the country’s most intense urban heat islands, with nearly all residents living where the built environment adds more than 8°F to temperatures (Climate Central, 2024).
How does heat vary across all of New Jersey’s 565 municipalities, and how does it relate to the state’s overburdened communities?
Using satellites to measure heat
Weather stations are sparse, so I used Landsat satellites, which measure land surface temperature: how hot the ground, roofs, and roads are. I used 10 clear Landsat images from summer 2024 (June–August). For each image, I calculated each municipality’s average surface temperature and subtracted the image’s average for all of New Jersey in view. That relative measure removes differences in weather between days and shows which places run hot compared with their surroundings.
Findings
The hottest towns
The hottest municipalities, compared with their surroundings, were dense, built-up places in Bergen, Hudson, and Passaic counties: South Hackensack, Teterboro (mostly an airport and warehouses), Wood-Ridge, Lodi, Garfield, Guttenberg, East Newark, Passaic, and Paterson, all about 10°C (18°F) warmer than the scene average on summer days. Several of the state’s largest cities rank near the top:
| City | Summer 2024 surface temp. vs. scene average | Rank (of 524) |
|---|---|---|
| Paterson | +9.5°C | 12 |
| Elizabeth | +9.4°C | 14 |
| Newark | +8.8°C | 22 |
| Trenton | +8.0°C | 34 |
| Camden | +7.0°C | 55 |
| Jersey City | +6.9°C | 59 |
The coolest places were forested areas of the Kittatinny Ridge, the Highlands, and the Pinelands (Figure 1).
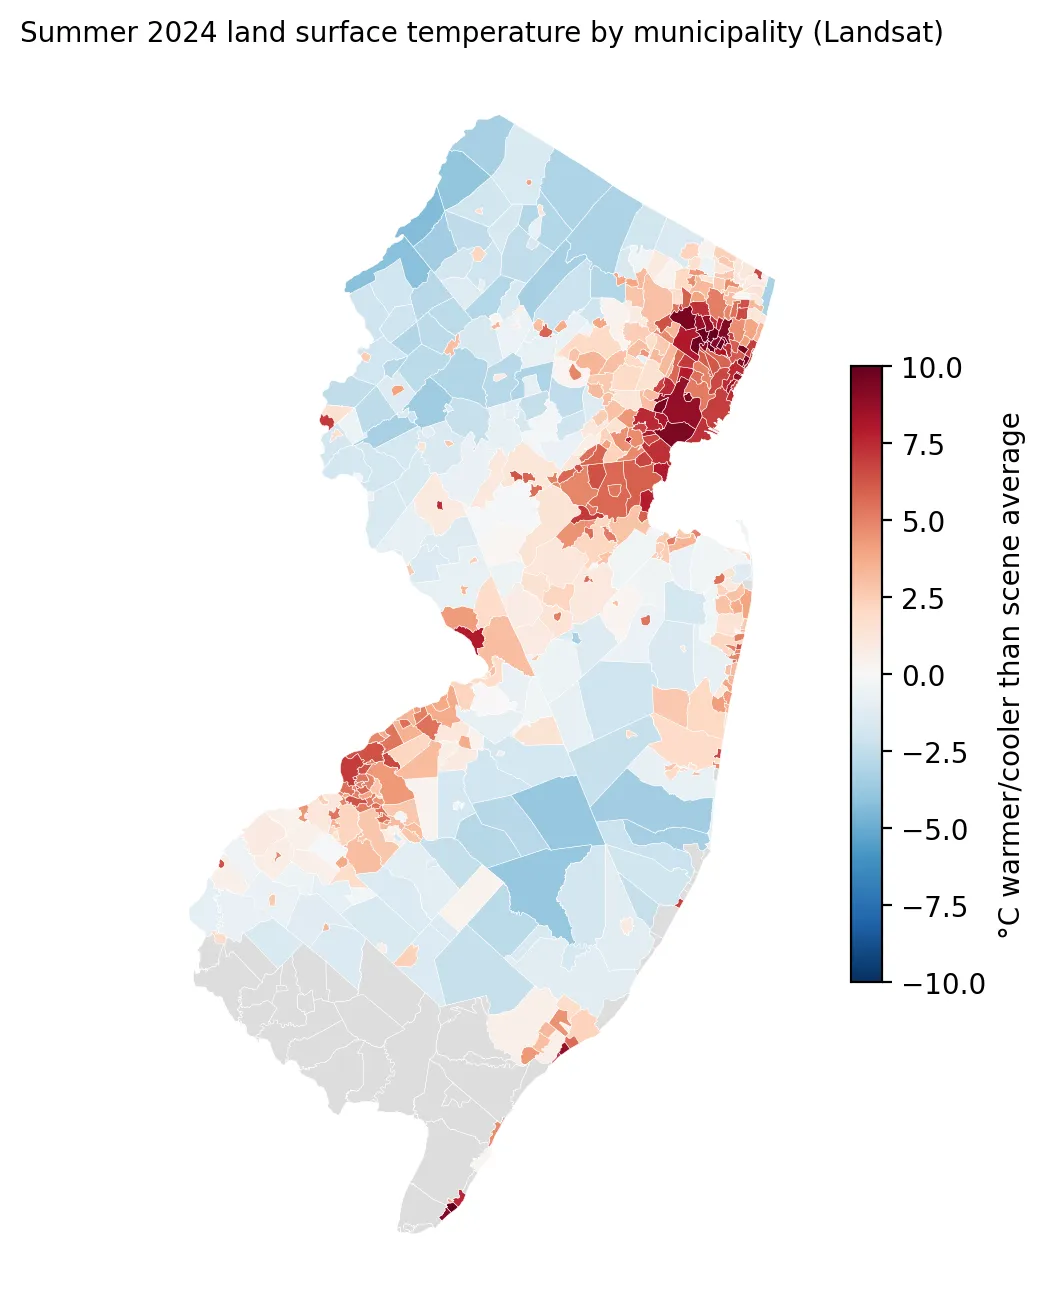 Figure 1. Summer 2024 surface temperatures were highest in dense northeastern cities and around Camden, and lowest in forested areas.
Overburdened communities run hotter
Municipalities with more residents in overburdened communities tend to be hotter (Spearman’s ρ = 0.57). Weighting by population, towns where at least 75% of residents live in an OBC averaged +6.3°C, while towns where 25% or fewer do averaged +0.8°C, a gap of about 5.5°C (10°F) in surface temperature.
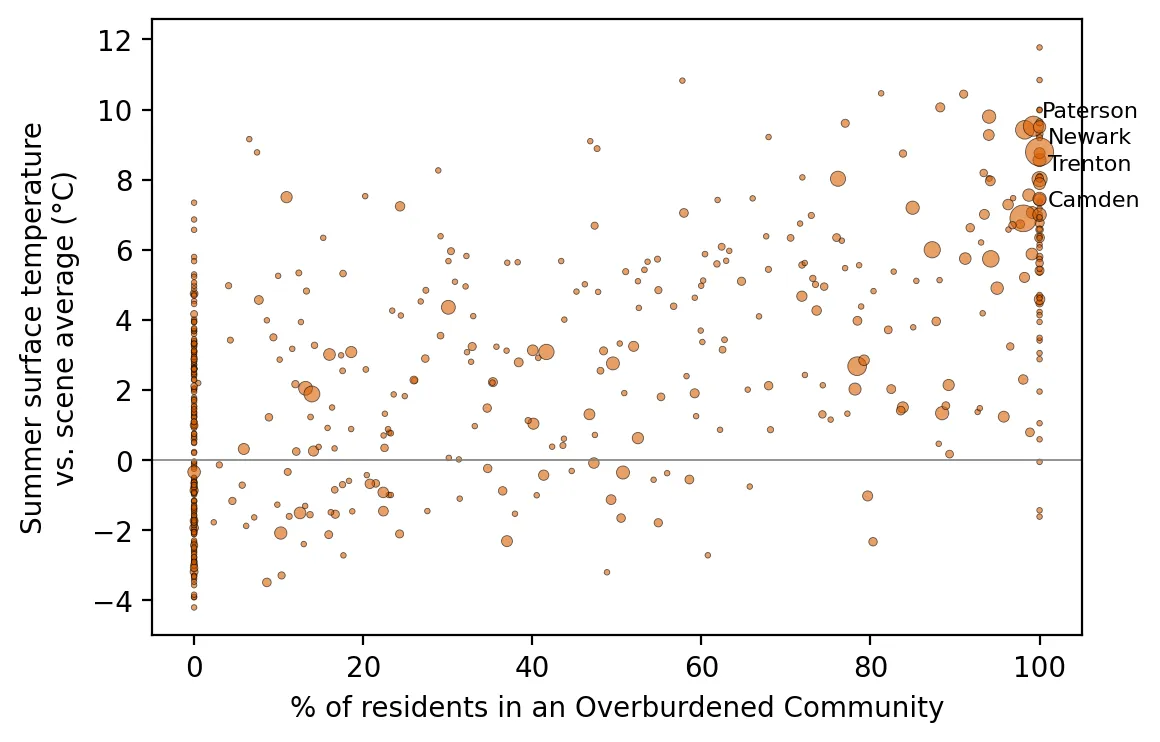 Figure 2. Municipalities with more residents in overburdened communities tend to have hotter summer surface temperatures.
But the real driver is pavement
The strongest predictor was not OBC status but impervious surface: the share of land covered by pavement and buildings. Its correlation with heat was ρ = 0.91, about as strong as relationships get in environmental data. Overburdened communities are hotter largely because they are more built-up. That matters for solutions. Planting trees, adding green space, and using lighter-colored “cool” roofs and pavements can cool a neighborhood regardless of its demographics.
Why this matters
Heat’s effects are not just about temperature. People without air conditioning, older adults, outdoor workers, and people with chronic illnesses face the greatest risk. In New Jersey’s hottest towns, many residents are renters in older buildings, and electricity bills had just jumped about 17–20% on June 1 (see my power plant post), which can make running an air conditioner a hard financial choice right when it matters most.
Limitations
- Surface temperature is not air temperature. Roofs and roads can be far hotter than the air people breathe, so these numbers exaggerate differences in what people feel.
- Relative, not absolute. Each value is compared with the average of the land visible in that image, which includes cool forests. The ranking is more meaningful than the exact numbers.
- Municipalities are big. Large towns contain both hot and cool neighborhoods. A later post will go down to the neighborhood level.
- Morning snapshots. Landsat passes over in mid-morning, not at the afternoon peak.
Code project (Level 2): my first satellite analysis
Goal: Estimate each New Jersey municipality’s summer surface temperature from Landsat.
Data: Landsat 8/9 Collection 2 Level-2 surface temperature (band ST_B10) and quality flags (QA_PIXEL), June–August 2024, through Microsoft’s Planetary Computer; NJDEP municipal boundaries; NJDEP OBC list and impervious-surface stressor (version in effect on the cutoff date).
Method:
- Search for summer 2024 scenes with less than 10% cloud cover.
- Convert raw values to °C:
value × 0.00341802 + 149.0 − 273.15. - Mask clouds, shadows, and water using the quality band.
- “Burn” municipal boundaries into a grid matching the image, then average temperature in each municipality (zonal statistics).
- Subtract each image’s statewide average, then average across images.
- Compare with OBC share and impervious surface using Spearman correlation.
lst = st.values * 0.00341802 + 149.0 - 273.15        # Kelvin-scaled integers → °C
zones = rasterize(zip(munis.geometry, munis.mid), out_shape=lst.shape, transform=transform)
mean_by_muni = np.bincount(zones[ok], weights=lst[ok]) / np.bincount(zones[ok])
New skills: cloud data catalogs (STAC), raster data, unit conversion from metadata, quality masks, and zonal statistics.
Data and methods
Data sources
- Landsat 8/9 Collection 2 Level-2 surface temperature (band ST_B10) and quality flags (QA_PIXEL), June–August 2024, through Microsoft's Planetary Computer; NJDEP municipal boundaries; NJDEP OBC list and impervious-surface stressor (version in effect on the cutoff date).
The analysis was done in Python with public data. The full code, its data, and every figure it produces are in the code project below.
References
- Climate Central. (2024). Urban heat islands 2024 [Climate Matters analysis]. https://www.climatecentral.org/climate-matters/urban-heat-islands-2024
- New Jersey 101.5. (2025, June 27). Heat wave recap: June 2025. https://nj1015.com/heat-wave-recap-june-2025/
- Patch. (2025, June 26). Newark ties its record highest temperature during NJ heatwave. https://patch.com/new-jersey/newarknj/newark-ties-its-record-highest-temperature-during-nj-heatwave
- U.S. Environmental Protection Agency. (n.d.). Learn about heat islands. https://www.epa.gov/heatislands/learn-about-heat-islands
- U.S. Geological Survey. (2024). Landsat 8–9 Collection 2 Level-2 science products [Data set], via Microsoft Planetary Computer. https://planetarycomputer.microsoft.com/dataset/landsat-c2-l2