
The Plants Behind the Bill: Who Lives Next to New Jersey's Power Plants?
The news
On June 1, 2025, electricity bills for most New Jersey households went up sharply. In February, the Board of Public Utilities (NJBPU) announced the results of the state’s annual power supply auction and projected that average monthly residential bills would rise by 17.2% to 20.2%, depending on the utility (NJBPU, 2025a, 2025b). The main cause was a spike in the regional grid’s capacity market, which pays power plants to be available when demand peaks.
Everyone pays for electricity. But not everyone lives next to where it’s made. New Jersey’s electricity comes partly from nuclear plants and solar panels, and partly from power plants that burn fuel, mostly natural gas, plus some oil, trash, and landfill gas. Burning fuel releases nitrogen oxides, which help form smog, along with fine particles and other pollutants. That’s why “major sources of air pollution,” including large power plants, are covered by New Jersey’s Environmental Justice Law.
This post asks: who lives near the power plants that burn fuel to keep New Jersey’s lights on?
Data
- Power plants: the U.S. Energy Information Administration’s survey of every power plant (Form EIA-860) for 2023, with each plant’s location, capacity, and fuel (U.S. EIA, 2024). I kept the 55 fuel-burning plants of 5 megawatts (MW) or more, totaling 12,894 MW.
- Neighborhoods: NJDEP’s overburdened community data (version in effect from January 31, 2025), with population, race, and income for every block group (NJDEP, 2025).
For every neighborhood, I added up the capacity of all fuel-burning plants within 1 mile and 3 miles of its center.
Findings
Most power plants are in overburdened communities
62% of the fuel-burning plants, and 65% of their capacity, sit inside overburdened block groups, even though those block groups cover only 22% of New Jersey’s populated land. Six of the ten largest are in overburdened block groups, including the PSEG Linden Generating Station (1,740 MW), the Bergen Generating Station in Ridgefield (1,401 MW), and the Linden Cogen Plant (974 MW).
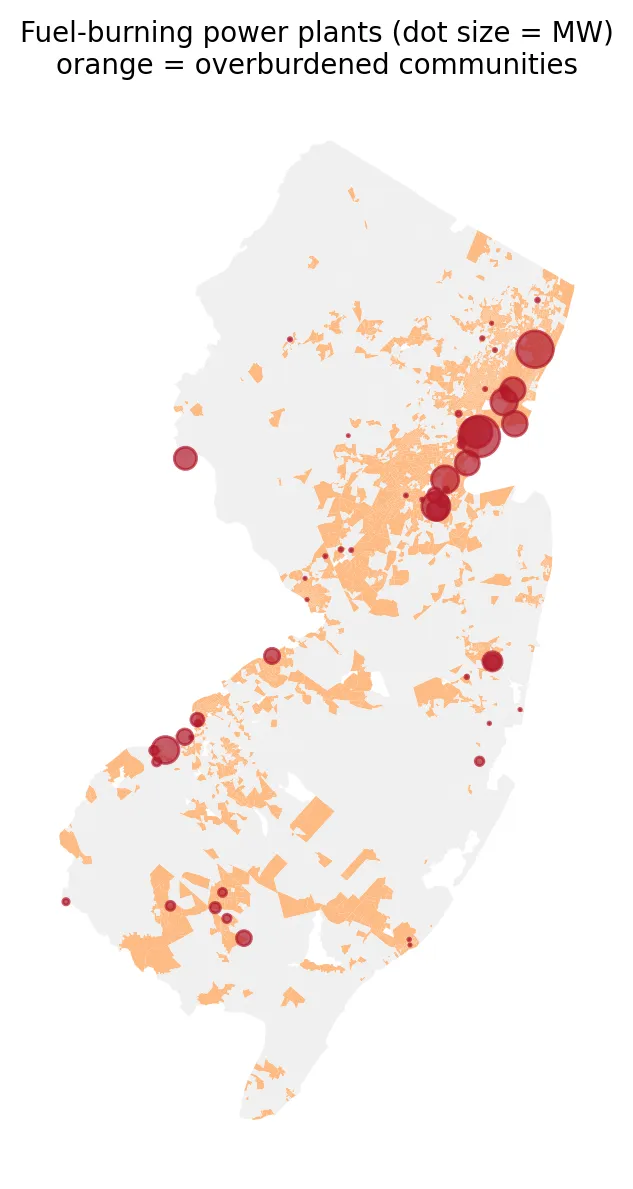 Figure 2. Most fuel-burning power plants, and the largest ones, sit inside or next to overburdened communities.
Residents of overburdened communities are three times as likely to live near one
| Overburdened community residents | Other residents | |
|---|---|---|
| Live within 1 mile of a fuel-burning plant | 6.9% | 1.9% |
| Live within 3 miles | 53.2% | 16.9% |
| Average plant capacity within 3 miles | 257 MW | 38 MW |
More than half of all overburdened community residents live within three miles of a fuel-burning power plant, compared with about one in six other New Jerseyans. On average, they have almost seven times as much generating capacity nearby.
The more diverse the neighborhood, the closer the plants
| Neighborhoods grouped by % people of color | Avg. % people of color | % of residents within 3 miles of a plant | Avg. MW within 3 miles |
|---|---|---|---|
| Fewest | 9% | 17% | 33 |
| 2nd | 24% | 17% | 41 |
| Middle | 43% | 30% | 106 |
| 4th | 67% | 52% | 307 |
| Most | 93% | 69% | 310 |
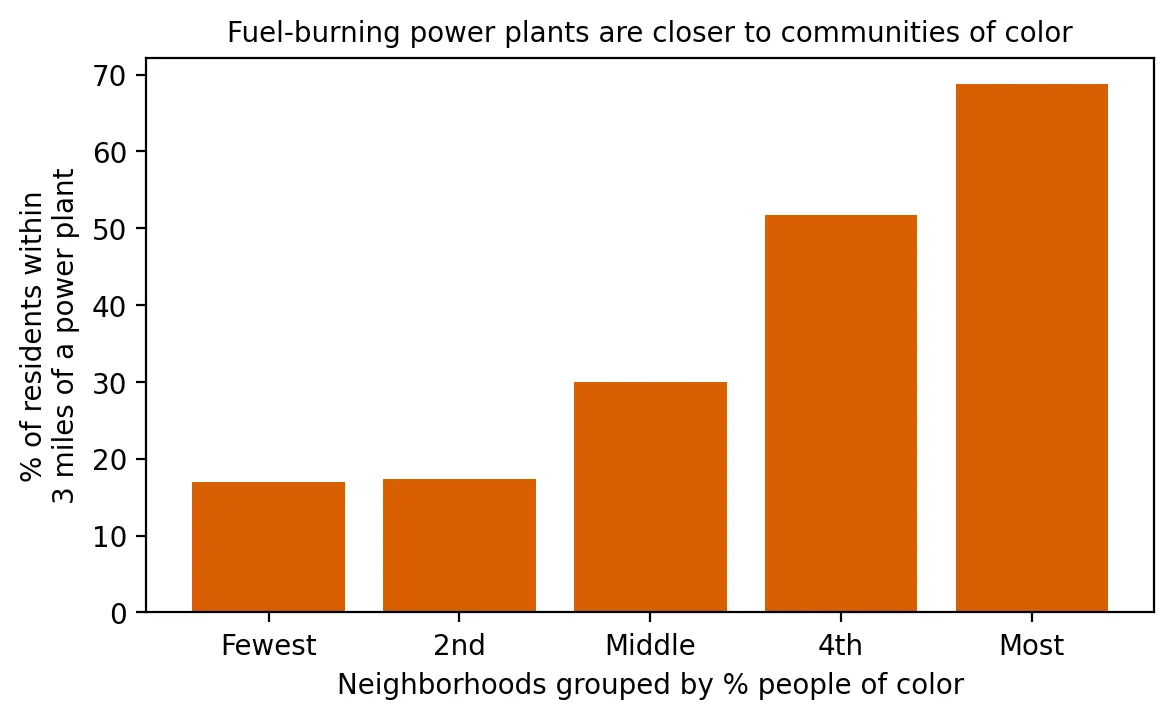 Figure 1. Residents of neighborhoods with more people of color are much more likely to live within 3 miles of a power plant.
In the neighborhoods with the most people of color, 69% of residents live within three miles of a fuel-burning power plant, four times the rate in the least diverse neighborhoods. Measured with Spearman’s rank correlation, nearby plant capacity rises with the share of people of color (ρ = 0.40) and with the share of low-income households (ρ = 0.29), both far too strong to be chance (p < 0.001).
Why this matters
When electricity prices rise, everyone feels it in their bills. But the pollution from making that electricity isn’t shared the same way: it lands most heavily on communities of color and low-income neighborhoods, which are also least able to absorb a 20% jump in their bills. This is one reason clean energy and battery storage that replace old fuel-burning plants matter so much for environmental justice.
Limitations
- Distance is not exposure. Stack height, wind, and pollution controls shape who breathes a plant’s emissions.
- Capacity isn’t emissions. Some large plants run rarely; others run nearly all the time.
- Industrial land. Some plants, like the Newark Energy Center, sit in industrial block groups with no residents. They count as “not in an overburdened community” even when overburdened neighborhoods surround them.
- Neighborhood centers. A neighborhood counts as “within 3 miles” if its center point is.
Code project (Level 2): who lives within range?
Goal: Measure how close New Jersey’s fuel-burning power plants are to overburdened communities and communities of color.
Data: EIA-860 2023 plant and generator files (New Jersey rows, archived November 2024); NJDEP OBC data (version effective January 31, 2025).
Steps:
- Select generators that burn fuel and add up capacity by plant; keep plants of 5 MW or more.
- Map plants and find which block group each sits in.
- Use a KD-tree (a fast way to find nearby points) to add up plant capacity within 1 and 3 miles of every neighborhood.
- Compare overburdened communities with others, and neighborhoods grouped by % people of color.
- Compute Spearman’s ρ between nearby capacity and % people of color or % low-income.
tree = cKDTree(np.c_[plants.x, plants.y])
nearby = tree.query_ball_point(np.c_[centers.x, centers.y], 3 * 5280)   # plants within 3 miles
bg["mw_3mi"] = [plants.MW.values[i].sum() for i in nearby]
spearmanr(bg.mw_3mi, bg.MINORITY_PCT)
New skills: finding neighbors within a radius and correlating exposure with demographics.
Data and methods
Data sources
- EIA-860 2023 plant and generator files (New Jersey rows, archived November 2024); NJDEP OBC data (version effective January 31, 2025).
The analysis was done in Python with public data. The full code, its data, and every figure it produces are in the code project below.
References
- New Jersey Board of Public Utilities. (2025a, February 12). NJBPU announces results of annual electricity auction [Press release]. https://www.nj.gov/bpu/newsroom/2025/approved/20250212.html
- New Jersey Board of Public Utilities. (2025b, February 12). Order: 2025 BGS auction results. https://nj.gov/bpu/pdf/boardorders/2025/20250212/LSA%20ORDER%202025%20BGS%20Auction%20Results.pdf
- New Jersey Department of Environmental Protection. (2025). Environmental Justice EJ Law Combined Stressor Summary 20250131 to 20260330 [Data set]. https://www.arcgis.com/home/item.html?id=8a9ae7bae7a0458fb0f8d3759b145257
- New Jersey Legislature. (2020). P.L.2020, c.92. https://pub.njleg.gov/bills/2020/PL20/92_.PDF
- U.S. Energy Information Administration. (2024). Form EIA-860 detailed data, 2023 [Data set; archived copy of November 16, 2024]. https://www.eia.gov/electricity/data/eia860/ (archive: https://web.archive.org/web/20241116185137/https://www.eia.gov/electricity/data/eia860/xls/eia8602023.zip)