
Chemical Fingerprints: What the DuPont Settlement Means, and What South Jersey's Water Shows
The settlement
On August 4, 2025, New Jersey announced a settlement with DuPont, Chemours, and Corteva to resolve the state’s claims over PFAS pollution from four industrial sites, most prominently the Chambers Works complex on the Delaware River in Salem County. The companies agreed to pay $875 million over 25 years and to back a remediation fund of up to $1.2 billion for cleanup. The other sites are Parlin, Pompton Lakes, and Repauno (ROI-NJ, 2025b; PhillyVoice, 2025; Manufacturing Dive, 2025). Chambers Works began as an explosives plant and later produced chemicals including PFAS. Combined with the state’s May 2025 settlement with 3M, worth up to $450 million (ROI-NJ, 2025a), New Jersey had secured well over a billion dollars in PFAS commitments within three months.
South Jersey has a second PFAS story. In 2023, the state reached a proposed settlement of about $393 million with Solvay over contamination from its plant in West Deptford, Gloucester County, which used a compound called PFNA (NJBIA, 2023). PFNA was discovered in the drinking water of nearby Paulsboro in 2013, and in 2018 New Jersey became the first state to set a drinking water limit for it (13 ng/L).
Different factories used different PFAS chemicals. Can we see those differences, a kind of chemical fingerprint, in the state’s drinking water?
Data and approach
I used EPA’s UCMR 5 results for New Jersey, keeping samples collected through March 2025 to approximate what was public by mid-August. I split water systems into South Jersey (Salem, Gloucester, Cumberland, Camden, Burlington, Atlantic, and Cape May counties; 75 systems) and Central/North Jersey (174 systems). For each PFAS compound, I compared the share of systems where it was detected at least once.
Findings
Most PFAS are less common in South Jersey’s public water
This surprised me. Given Chambers Works and the West Deptford plant, I expected South Jersey to have more PFAS in its water. For most compounds, the opposite was true:
| Compound | South Jersey systems with detection | Central/North Jersey | Fisher’s exact p |
|---|---|---|---|
| PFOA | 36% | 68% | < 0.001 |
| PFBS | 7% | 31% | < 0.001 |
| PFBA | 9% | 32% | < 0.001 |
| PFOS | 23% | 41% | 0.006 |
| PFNA | 9% | 2% | 0.020 |
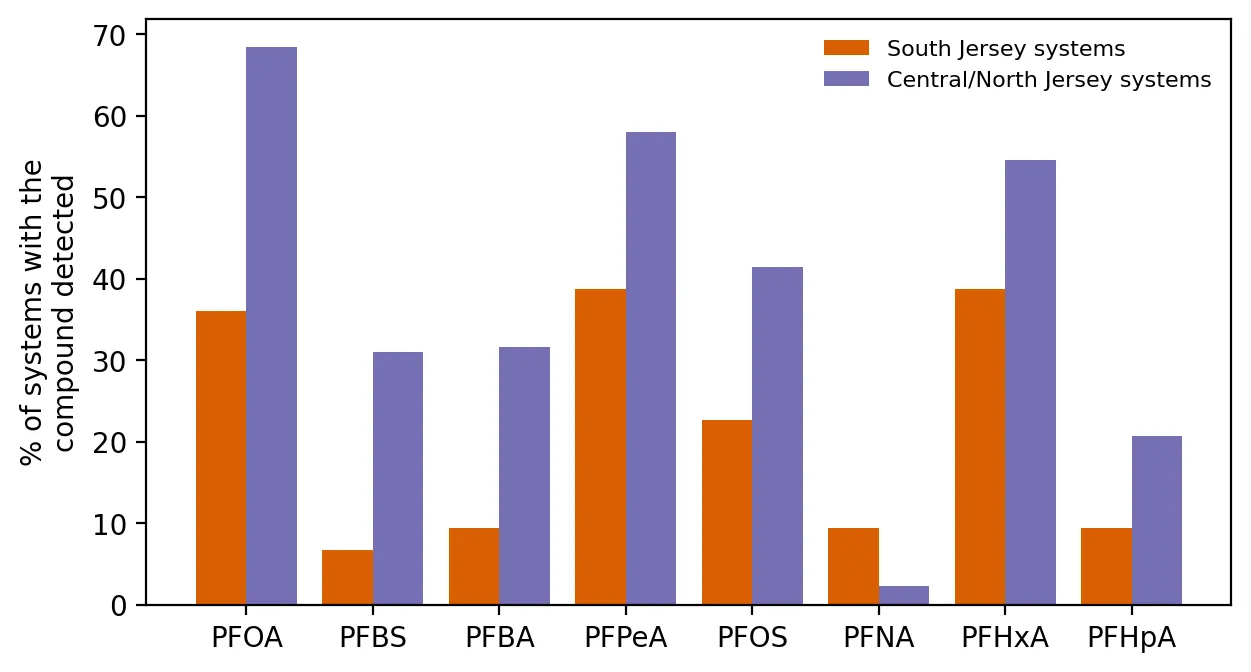 Figure 2. Most PFAS compounds are detected less often in South Jersey water systems, but PFNA is the exception.
One plausible explanation is the source of the water. Many large North Jersey systems draw from rivers and reservoirs like the Passaic and Raritan, which collect runoff and wastewater from a heavily developed region. Many South Jersey systems pump groundwater. Contamination there tends to be concentrated in specific plumes rather than spread throughout the water supply.
PFNA is the exception, and it points to West Deptford
PFNA was the only compound detected more often in South Jersey. Of the 11 New Jersey systems where it was found, the highest results clustered tightly around West Deptford:
| System | County | Highest PFNA (ng/L) |
|---|---|---|
| East Greenwich Township | Gloucester | 73.3 |
| Westville | Gloucester | 16.7 |
| Brooklawn | Camden | 15.3 |
| West Deptford Township | Gloucester | 14.0 |
| Eagle Point Tank Farm | Gloucester | 9.0 |
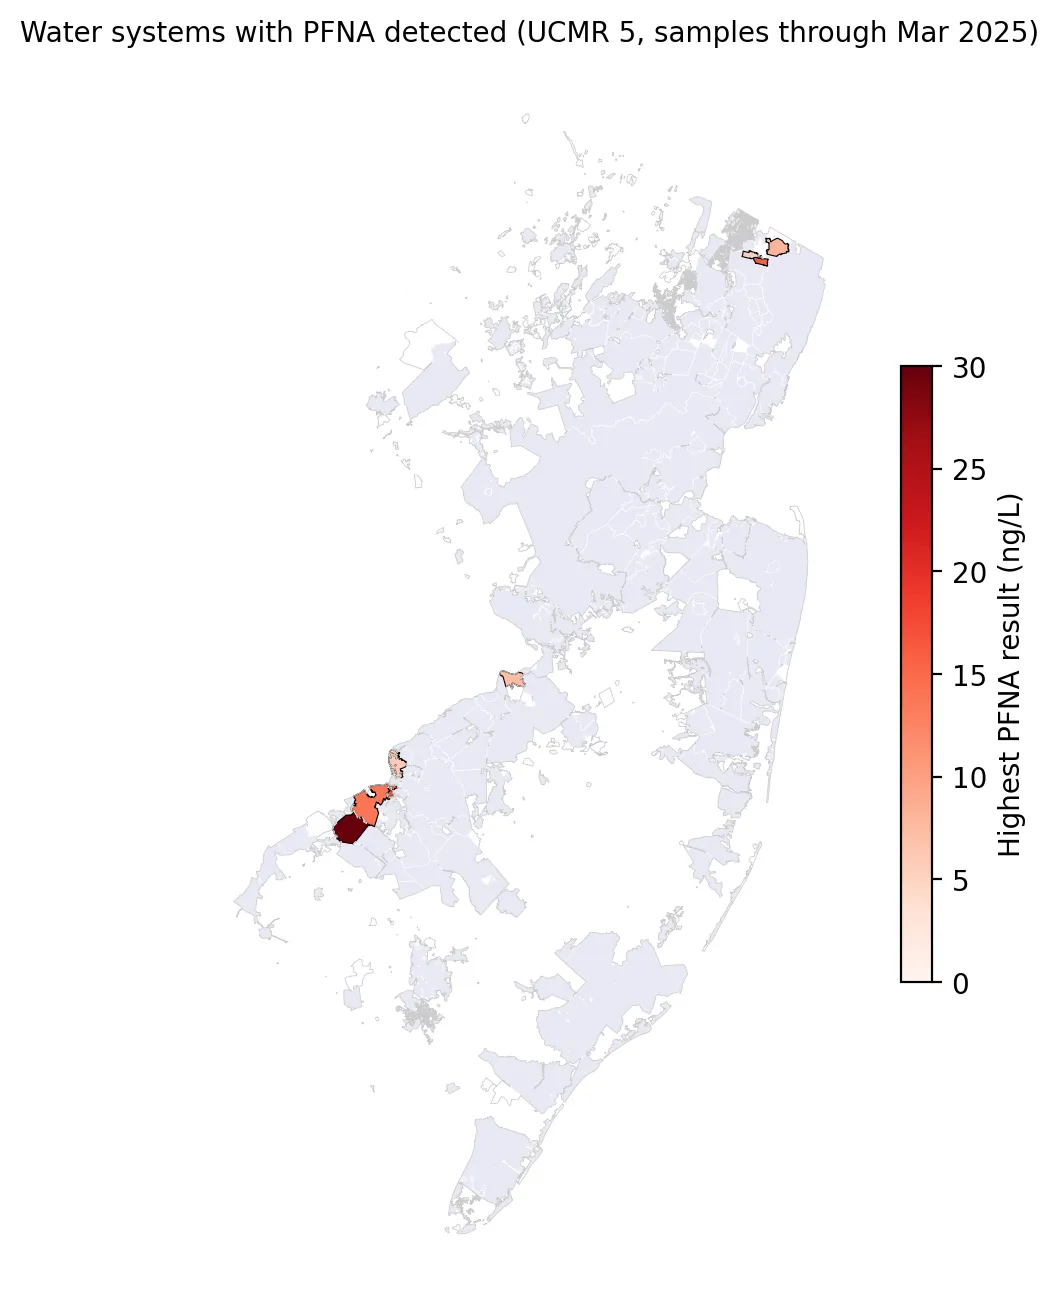 Figure 1. The highest PFNA results in drinking water cluster in southwestern New Jersey around West Deptford.
The East Greenwich result is more than five times New Jersey’s PFNA limit. A few Bergen County systems (Ho-Ho-Kus, Park Ridge, Waldwick) also detected PFNA, which suggests other sources there. But the South Jersey cluster matches the location of the known PFNA manufacturer.
These are single samples, not compliance determinations. Still, the pattern shows how drinking water data can point back to a likely source.
Why this matters for the settlements
Settlement money is often described as statewide relief, but contamination is local. The West Deptford PFNA cluster shows that specific communities carry the burden of specific facilities. How settlement funds are divided, and whether communities next to the plants get priority for treatment, testing of private wells, and health studies, will shape whether the settlements feel like justice to the people living nearby. The UCMR data cover public water systems only. Many homes near these plants rely on private wells, which this data set does not include.
Limitations
- Multiple comparisons. I tested nine compounds. With many tests, some “significant” results can occur by chance. Using a stricter cutoff (0.05 ÷ 9 ≈ 0.006) would leave PFOA, PFBS, PFBA, PFPeA, and PFOS as significant, but not PFNA. The PFNA pattern is suggestive, and its geographic clustering strengthens it, but it is not definitive.
- Detection is not concentration. A system with one low detection counts the same as one with high levels.
- Region boundaries are my choice. Different county groupings could change the results.
Code project (Level 2): fingerprints and Fisher’s exact test
Goal: Compare PFAS detection rates between South Jersey and the rest of the state, compound by compound, and map PFNA.
Data: EPA UCMR 5 (New Jersey, samples collected ≤ 2025-03-31); EPA ECHO counties served; NJDEP water service areas.
Method:
- For each system and compound, record whether the compound was ever detected.
- Build a 2×2 table per compound (region × detected) and run Fisher’s exact test, which works better than chi-square when some cells have few systems, as PFNA does.
- List and map systems where PFNA was detected.
from scipy.stats import fisher_exact
table = [[south_detected, south_not], [north_detected, north_not]]
odds_ratio, p = fisher_exact(table)
New skills: choosing the right test for small counts, and the problem of multiple comparisons.
Data and methods
Data sources
- EPA UCMR 5 (New Jersey, samples collected ≤ 2025-03-31); EPA ECHO counties served; NJDEP water service areas.
The analysis was done in Python with public data. The full code, its data, and every figure it produces are in the code project below.
References
- Manufacturing Dive. (2025, August 5). DuPont, Corteva, Chemours reach PFAS settlement with New Jersey. https://www.manufacturingdive.com/news/dupont-corteva-chemours-pfas-settlement-new-jersey-environmental-protection/756729/
- New Jersey Business & Industry Association. (2023). New Jersey, Solvay announce $393M settlement in PFAS pollution case. https://njbia.org/new-jersey-solvay-announce-393m-settlement-in-pfas-pollution-case/
- PhillyVoice. (2025, August 4). New Jersey reaches PFAS settlement with DuPont over "forever chemicals." https://www.phillyvoice.com/new-jersey-pfas-settlement-dupont-forever-chemicals/
- ROI-NJ. (2025a, May 14). State settlement with 3M over "forever chemicals" worth up to $450M. https://www.roi-nj.com/2025/05/14/industry/state-settlement-with-3m-over-forever-chemicals-worth-up-to-450m/
- ROI-NJ. (2025b, August 4). Companies reach $875 million accord to resolve environmental claims. https://www.roi-nj.com/2025/08/04/industry/companies-reach-875-million-accord-to-resolve-environmental-claims/
- U.S. Environmental Protection Agency. (2025). UCMR 5 occurrence data [Data set]. https://www.epa.gov/dwucmr/occurrence-data-unregulated-contaminant-monitoring-rule