
The Warehouse Boom: Are Trucks and Diesel Concentrated in Overburdened Communities?
The news
In November 2025, a Rutgers study reported that New Jersey had about 1.02 billion square feet of warehouse and distribution space in buildings of 20,000 square feet or more, nearly 956 million of it occupied, supporting about 764,000 jobs inside those buildings (NJBIZ, 2025). New Jersey’s location next to the Port of New York and New Jersey and the country’s densest consumer market has made it one of the nation’s largest logistics hubs.
Warehouses themselves emit little, but they attract diesel trucks. Diesel exhaust contains fine particles linked to asthma, heart disease, and cancer, and a major review found the evidence “sufficient” that traffic pollution worsens asthma, especially within a few hundred meters of busy roads (Health Effects Institute, 2010). A 2024 report by the Environmental Defense Fund and partners estimated that about one in three New Jerseyans lives within half a mile of a large warehouse (Clean Water Action, 2024; EDF, 2024). In July 2024, state legislators introduced the Warehouse and Port Pollution Reduction Act (S3546), which would require high-traffic warehouses to reduce truck emissions. As of December 2025, it had not passed (New Jersey Legislature, 2024).
Warehouses are not among the facilities covered by New Jersey’s Environmental Justice Law. Does freight pollution fall disproportionately on overburdened communities anyway?
Data
NJDEP’s environmental justice dataset (the version in effect in December 2025) includes two freight-related measures for every block group:
- Heavy-duty truck traffic: truck volumes on nearby roads per square mile.
- Diesel particulate matter: modeled diesel exhaust exposure. NJDEP labels this field “cancer risk per million,” but the values look like annual concentrations, so I treat it as a relative indicator.
Findings
Raw gaps: trucks twice as heavy
| Measure (population-weighted) | Overburdened communities | Other communities | Ratio |
|---|---|---|---|
| Heavy-duty truck traffic | 10,008 | 4,914 | 2.0× |
| Diesel PM indicator | 0.34 | 0.21 | 1.6× |
Residents of overburdened communities live with about twice the truck traffic and 60% more diesel exhaust than other residents.
Do the gaps survive fair comparisons?
Overburdened communities are concentrated in urban counties where everyone is exposed to more traffic. To test whether the gap is just “urban vs. rural,” I ran regressions that add controls step by step:
- Raw: OBC vs. non-OBC.
- County fixed effects: compare block groups only within the same county.
- County fixed effects + impervious surface: also control for how built-up the area is.
Because truck and diesel values are skewed (a few block groups have extremely high values), I used logarithms, so the coefficients can be read as percentage differences.
| Model | Truck traffic: OBC difference | Diesel PM: OBC difference |
|---|---|---|
| Raw | +145% | +63% |
| Within county | +166% | +16% |
| Within county + built-up control | +121% | +4% |
All differences are statistically significant (p < 0.01).
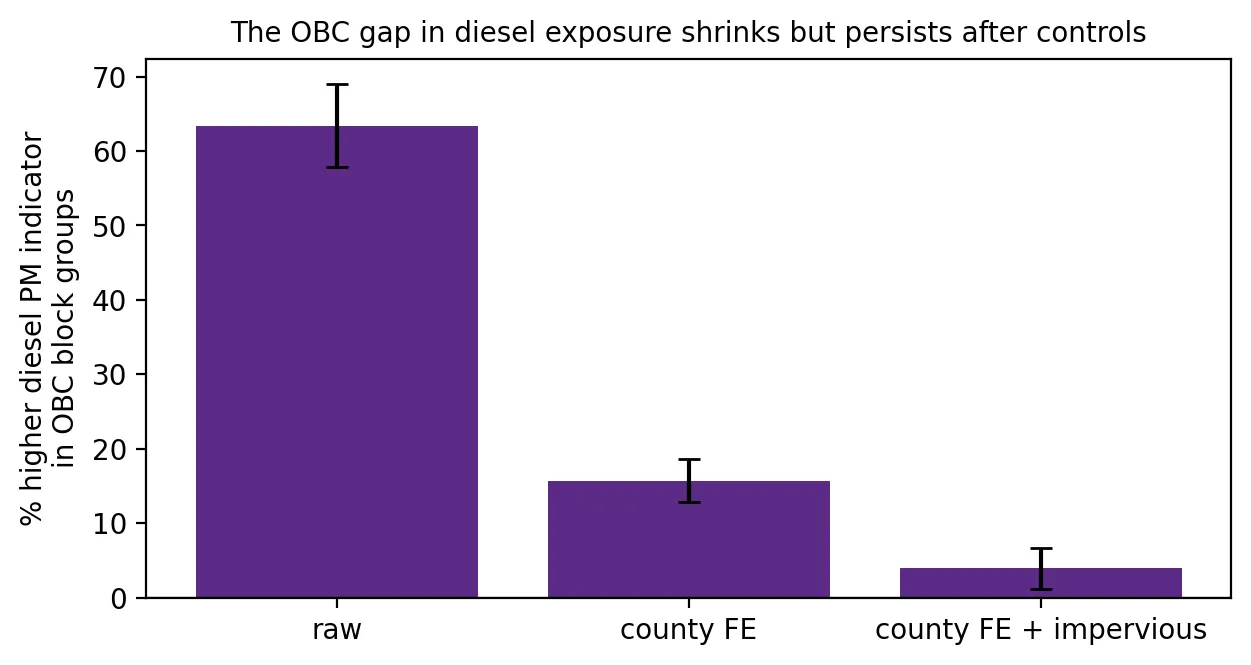 Figure 1. The diesel exposure gap for overburdened communities shrinks with controls but does not disappear.
The two measures tell different stories:
- Truck traffic stays sharply higher in OBCs, even compared with equally built-up neighborhoods in the same county (+121%). That points to routing and siting: highways, truck routes, ports, and industrial zones run through overburdened neighborhoods more than through similar non-OBC neighborhoods nearby.
- The diesel gap mostly disappears (+4%). Diesel particles drift for miles, so exposure is spread across whole urban areas. Once location and urbanization are accounted for, OBC status adds little. Diesel exposure is a regional urban problem, while truck traffic is a neighborhood problem.
The highest-exposure towns
The towns with the highest diesel indicator (10,000+ residents) are mostly in Hudson County: Weehawken, Hoboken, Union City, Guttenberg, and West New York. Bergen County’s Fort Lee and Palisades Park sit near the George Washington Bridge approaches, and Harrison has very high truck traffic. Most are overwhelmingly overburdened. Hoboken is an exception, a mostly non-OBC city that is also heavily exposed because of its location.
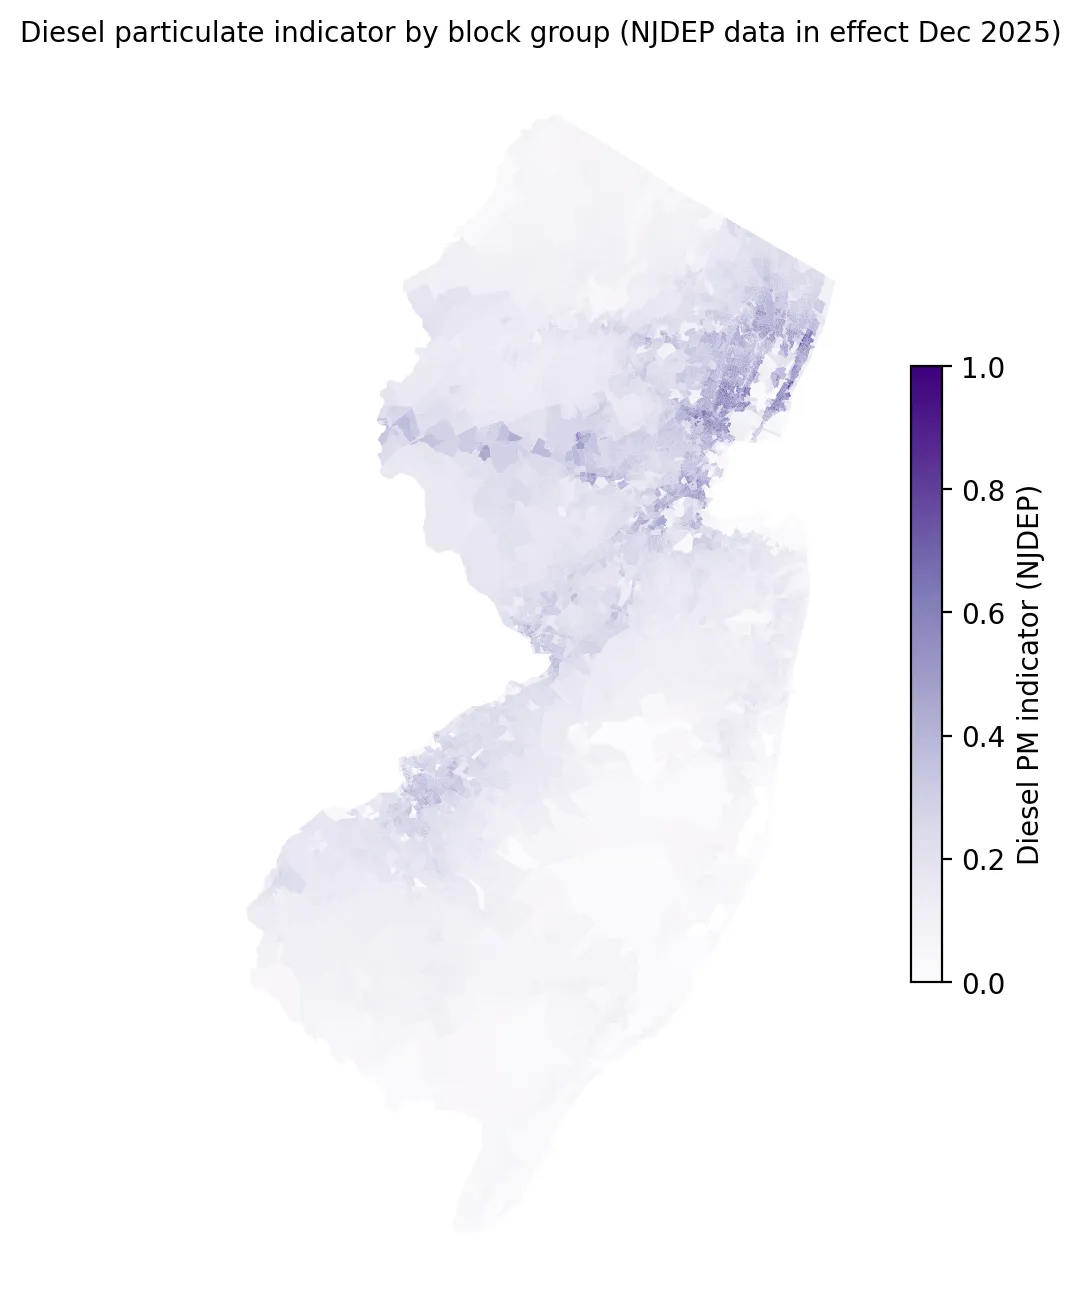 Figure 2. Diesel particulate exposure is concentrated in the urban northeast and along major highway and port corridors.
What this means for the warehouse debate
If truck traffic concentrates in overburdened neighborhoods even after accounting for urbanization, then policies that manage where trucks go and what they emit, such as indirect source rules, truck routing, and electrification incentives near warehouses and ports, could reduce a real disparity. Regional diesel exposure, meanwhile, calls for broader measures like cleaner truck fleets and port electrification.
Limitations
- Modeled data. Both measures come from models and traffic counts, not direct monitoring in each neighborhood.
- No warehouse locations. This analysis does not identify warehouses directly. It measures the traffic and exhaust associated with freight.
- Controls are imperfect. Impervious surface is a rough stand-in for urbanization.
Code project (Level 3): controls, fixed effects, and logs
Goal: Test whether truck and diesel exposure is higher in OBCs after accounting for county and urbanization.
Data: NJDEP EJ Law stressor data (version effective Jan 31, 2025 – Mar 30, 2026).
Method:
- Calculate population-weighted averages for OBC and non-OBC residents.
- Log-transform the skewed outcomes (
log1pfor truck traffic, which includes zeros). - Fit three weighted regressions, adding county fixed effects and then impervious surface.
- Convert log coefficients to percentages:
(exp(b) − 1) × 100.
m = smf.wls("log_diesel ~ is_obc + IMPSURFACE_BG + C(COUNTY)", data=d, weights=d.TOTALPOP).fit(cov_type="HC1")
pct = (np.exp(m.params["is_obc[T.True]"]) - 1) * 100
New skills: log transformations, interpreting coefficients as percentages, and watching how estimates change as controls are added.
Data and methods
Data sources
- NJDEP EJ Law stressor data (version effective Jan 31, 2025 – Mar 30, 2026).
The analysis was done in Python with public data. The full code, its data, and every figure it produces are in the code project below.
References
- Clean Water Action. (2024). New report: Roughly one in three New Jersey residents lives within a half mile of a mega-warehouse [Press release]. https://cleanwater.org/releases/new-report-roughly-one-three-new-jersey-residents-lives-within-half-mile-mega-warehouse
- Environmental Defense Fund. (2024, June 14). New Jersey's warehouse boom [Report]. https://cleanwater.org/sites/default/files/2024-06/NJ-Warehouse-Boom-Report-EDF-6-14-2024.pdf
- Health Effects Institute. (2010). Traffic-related air pollution: A critical review of the literature on emissions, exposure, and health effects (Special Report 17). https://www.healtheffects.org/publication/traffic-related-air-pollution-critical-review-literature-emissions-exposure-and-health
- New Jersey Legislature. (2024). Senate Bill No. 3546: Warehouse and Port Pollution Reduction Act (2024–2025 session). https://pub.njleg.gov/Bills/2024/S4000/3546_I1.HTM
- NJBIZ. (2025, November). NJ warehouses drive $295.8B economic impact. https://njbiz.com/nj-warehouses-distribution-centers-economic-impact/