
Is the Water Safe? Health-Based Drinking Water Violations in New Jersey
Background
Under the federal Safe Drinking Water Act, public water systems must meet health-based standards for contaminants and treatment. When they don’t, it counts as a health-based violation, for example when bacteria are found, lead levels exceed the “action level,” or a chemical goes above its legal limit. A national study by the Natural Resources Defense Council and partners found that water systems that stayed out of compliance the longest were more likely to serve communities with larger shares of people of color and residents with limited English (NRDC, 2019).
Earlier posts looked at specific contaminants such as PFAS and lead. This post takes a broader view: across all health-based standards, are violations more common in water systems serving New Jersey’s overburdened communities?
Data
EPA publishes every drinking water violation reported by states through its ECHO database, including the date each violation was first reported (U.S. EPA, n.d.-a). That field lets me avoid hindsight. I kept only health-based violations whose non-compliance began between April 2021 and March 2026 (five years) and that had been reported by May 7, 2026.
I focused on New Jersey’s 555 active community water systems, the ones that serve people where they live, and calculated the share of each system’s service-area residents living in an overburdened community (OBC).
Findings
What the violations are
There were 966 health-based violations at 551 systems in this period, across all system types. Most involved two rules:
- Revised Total Coliform Rule (439): bacterial contamination or failure to fix sanitary defects.
- Lead and Copper Rule (334): failures related to lead control and treatment.
Smaller numbers involved nitrate, disinfection byproducts (TTHM), and naturally occurring radioactive elements.
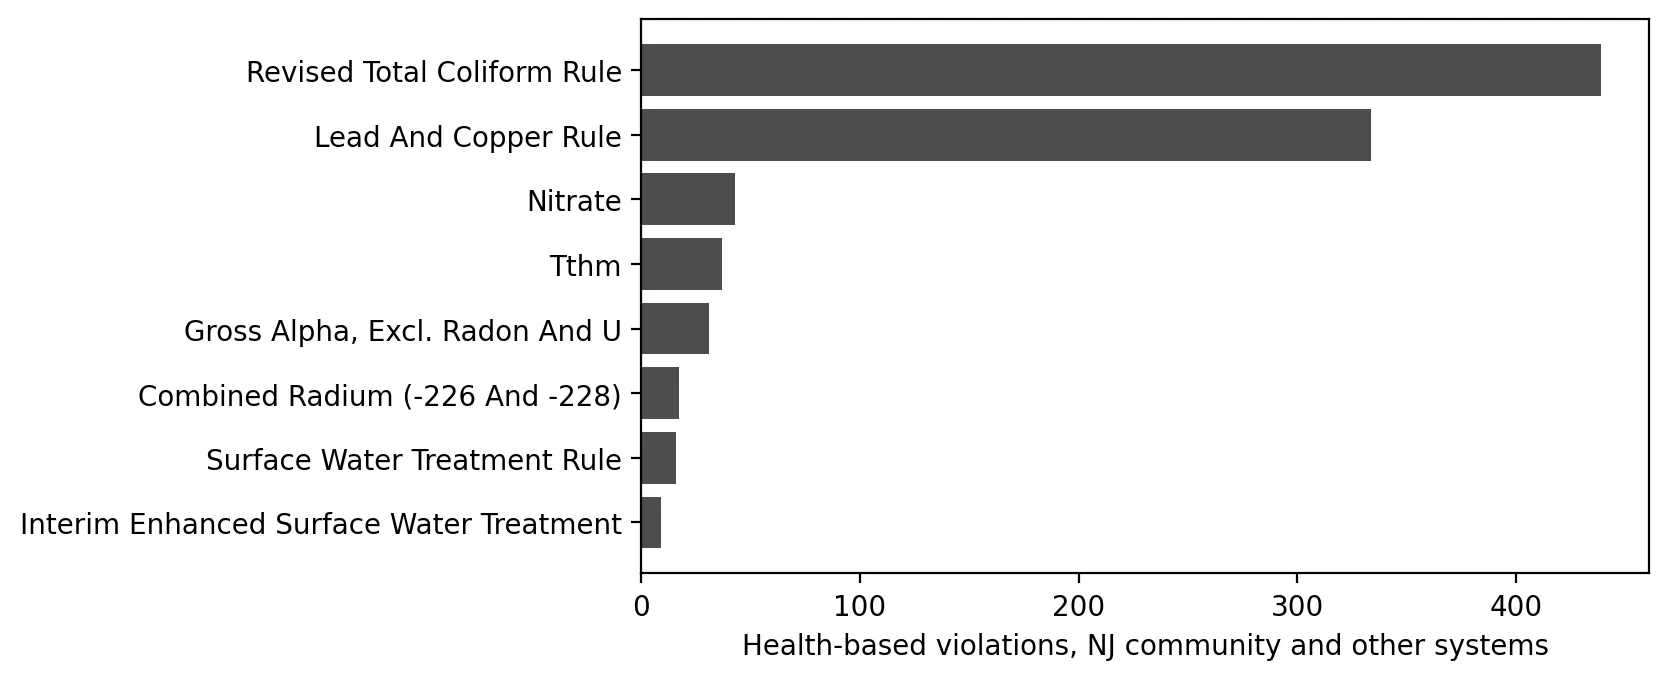 Figure 2. Coliform and lead and copper rule violations account for most health-based drinking water violations.
Systems serving overburdened communities had more violations
| Share of service-area residents in an OBC | Systems | % with ≥ 1 health-based violation | Mean violations per system |
|---|---|---|---|
| Under 25% | 359 | 18% | 0.40 |
| 25–75% | 74 | 19% | 0.49 |
| Over 75% | 114 | 32% | 0.76 |
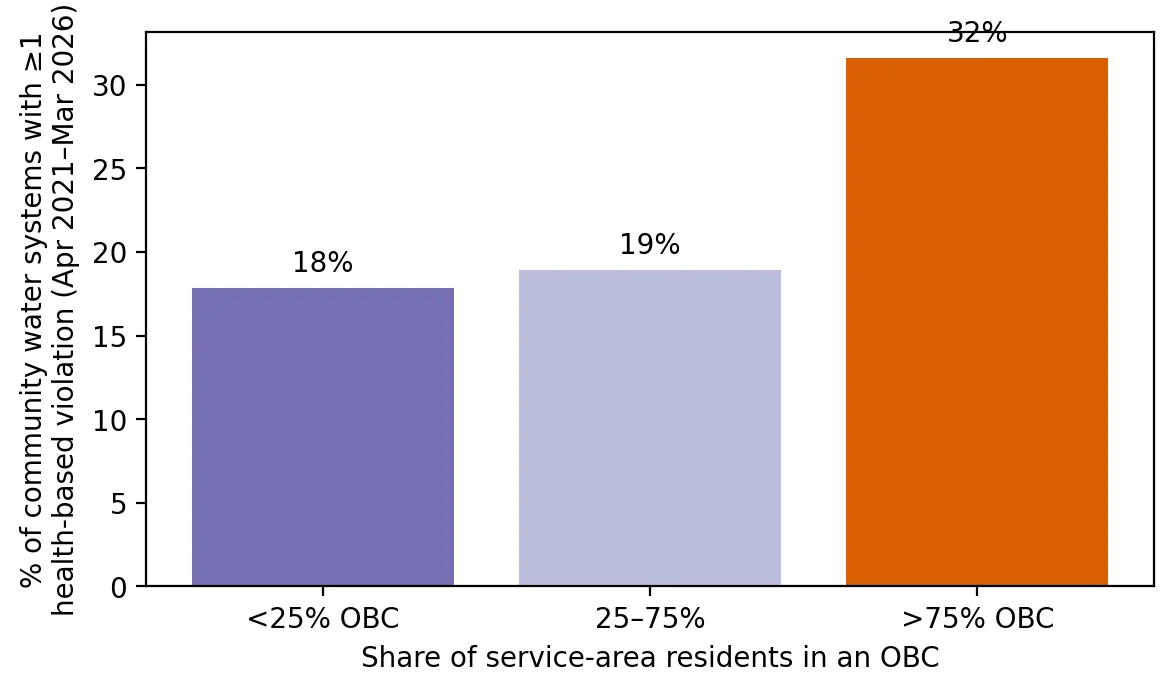 Figure 1. Water systems serving mostly overburdened communities are more likely to have a health-based violation.
Testing it with a count model
Violation counts are small whole numbers, mostly zeros, so I modeled them with count regression. A first Poisson model showed overdispersion: the counts varied about 3.7 times more than the model assumes (variance 1.9 vs. mean 0.5). When that happens, Poisson standard errors are too small, so I also fit a negative binomial model, which allows extra variation. It fit much better (AIC 919 vs. 1,262).
| Predictor (negative binomial) | Rate ratio (95% CI) | p-value |
|---|---|---|
| +10 points OBC share | 1.07 (1.01–1.14) | 0.028 |
| System size (10× population) | 0.58 (0.39–0.87) | 0.009 |
| Surface-water source | 1.77 (0.95–3.32) | 0.075 |
| Privately owned | 0.46 (0.22–0.94) | 0.034 |
Holding system size, source, and ownership constant, each 10-point increase in OBC share is associated with about 7% more health-based violations. Going from a service area with no OBC residents to one that is entirely OBC corresponds to roughly twice the expected violations (1.07¹⁰ ≈ 2.0). Larger systems have fewer violations per system, consistent with economies of scale in staff, testing, and treatment.
Why this matters
Many violations are fixed quickly. A single coliform detection may lead to flushing and retesting within days. But the pattern matters: if systems serving overburdened communities violate standards more often, residents there are more likely to receive boil-water notices, to drink water that briefly failed a standard, and to lose trust in their tap water. Small and older systems often lack money and trained staff. Programs that help systems consolidate, hire operators, and replace aging infrastructure, especially in overburdened communities, could address the root causes.
Limitations
- Counts, not severity or duration. One brief coliform detection counts the same as a long lead exceedance.
- Reporting depends on monitoring. Systems that monitor more may find more violations, and missed monitoring is a separate (non-health-based) category.
- Service-area demographics are approximate. For small systems whose service areas contain no block-group center, I used the block group at the service area’s own point.
- Association, not cause. OBC share may stand in for system age, finances, or other unmeasured factors.
Code project (Level 4): count models and overdispersion
Goal: Test whether health-based violations are more frequent in systems serving overburdened communities, using an appropriate model for count data.
Data: EPA ECHO SDWA bulk download (violations, water system details, reference codes), filtered to New Jersey; NJDEP water service areas; NJDEP EJ data (Mar 31, 2026 version).
Method:
- Stream the 4 GB national violations file and keep New Jersey rows.
- Keep health-based violations with non-compliance beginning April 2021 – March 2026 and first reported by the cutoff date (the anti-hindsight filter).
- Count violations per active community water system and attach OBC share, size, source, and ownership.
- Fit Poisson and negative binomial models, check dispersion, and compare AIC.
pois = smf.glm(f, data=d, family=sm.families.Poisson()).fit()
print(pois.pearson_chi2 / pois.df_resid)          # ≈ 3.7 → overdispersed
nb = smf.negativebinomial(f, data=d).fit()
print(np.exp(nb.params))                          # rate ratios
New skills: handling very large files, diagnosing overdispersion, and choosing between count models.
Data and methods
Data sources
- EPA ECHO SDWA bulk download (violations, water system details, reference codes), filtered to New Jersey; NJDEP water service areas; NJDEP EJ data (Mar 31, 2026 version).
The analysis was done in Python with public data. The full code, its data, and every figure it produces are in the code project below.
References
- Natural Resources Defense Council, Coming Clean, & Environmental Justice Health Alliance. (2019). Watered down justice. https://www.nrdc.org/resources/watered-down-justice
- U.S. Environmental Protection Agency. (n.d.-a). ECHO: SDWA data download summary. https://echo.epa.gov/tools/data-downloads/sdwa-download-summary
- U.S. Environmental Protection Agency. (n.d.-b). Revised Total Coliform Rule and Total Coliform Rule. https://www.epa.gov/dwreginfo/revised-total-coliform-rule-and-total-coliform-rule
- U.S. Environmental Protection Agency. (n.d.-c). Lead and Copper Rule. https://www.epa.gov/dwreginfo/lead-and-copper-rule
- New Jersey Department of Environmental Protection. (2026). Environmental Justice (EJ) Law Combined Stressor Summary (Current) [Data set]. https://www.arcgis.com/home/item.html?id=8f1eeb5074d147af8ab3e5e5a4f72d2b