
Earth Day 2026: The Air Toxics Picture in New Jersey
What “air toxics” are
Beyond the familiar pollutants like ozone and fine particles, the Clean Air Act regulates 188 hazardous air pollutants, or “air toxics”: chemicals such as benzene, formaldehyde, ethylene oxide, and 1,3-butadiene that are known or suspected to cause cancer or other serious health effects. Every few years, the U.S. EPA runs AirToxScreen, a national model that estimates air toxics concentrations and the resulting lifetime cancer risk for every census block. As of April 2026, the most recent assessment with cancer risk estimates covered 2020 emissions and was released in 2024 (U.S. EPA, n.d.-a, 2024).
AirToxScreen reports risk “per million.” A risk of 30 in a million means that if one million people breathed that air for a 70-year lifetime, about 30 additional cancers might be expected. EPA describes AirToxScreen as a screening tool for identifying places that deserve closer study, not a precise measure of any person’s risk (U.S. EPA, n.d.-b).
Data and method
I used AirToxScreen 2020 cancer risk for all 113,212 populated census blocks in New Jersey, broken down by emission source, and combined it with NJDEP’s overburdened community (OBC) list in effect in April 2026. To estimate uncertainty, I used a cluster bootstrap: resampling whole block groups (not individual blocks, which are not independent) 2,000 times.
Findings
A small but real overall gap
| Population-weighted modeled cancer risk (per million) | |
|---|---|
| Residents of overburdened communities | 29.7 |
| Other residents | 28.3 |
| Difference (95% CI) | 1.4 (1.3–1.6) |
Overburdened community residents face about 5% higher modeled cancer risk from air toxics. The difference is statistically clear, but small in absolute terms, because most of New Jersey’s modeled risk comes from pollution that is spread across the entire region.
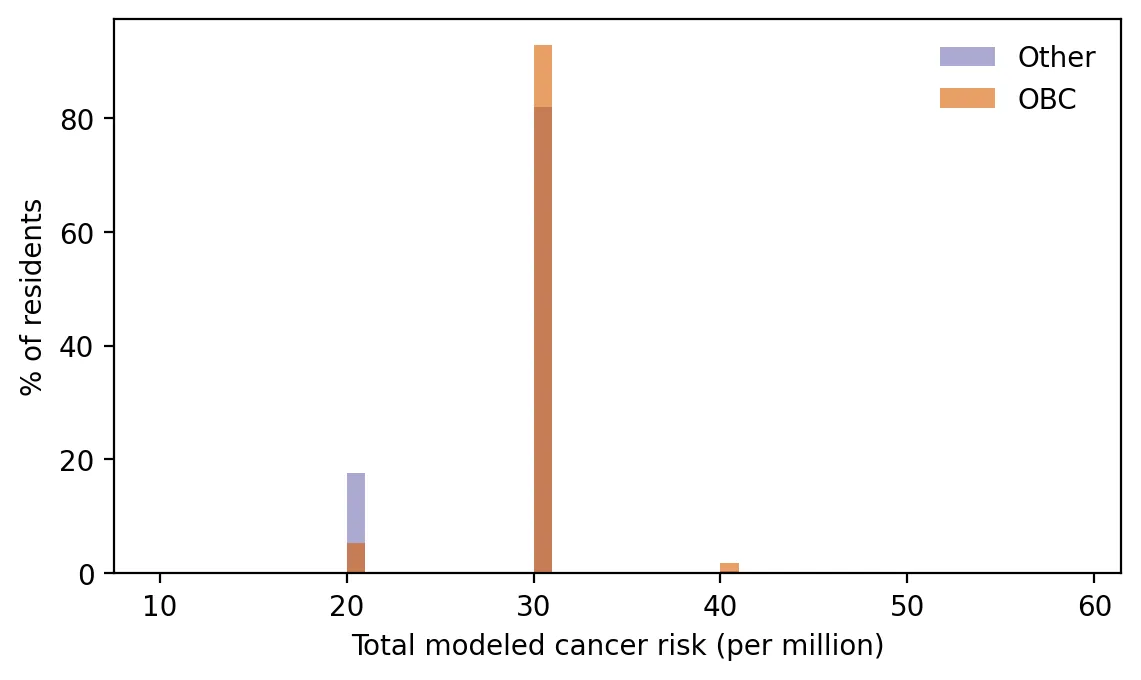 Figure 2. Modeled cancer risk from air toxics is similar for most residents, with overburdened communities slightly more likely to be in higher-risk groups.
Where the gap comes from
Breaking risk down by source tells a more interesting story:
| Source group | OBC | Other | Gap | Share of gap |
|---|---|---|---|---|
| Secondary formation (chemicals formed in the air) | 15.75 | 15.32 | 0.43 | 16% |
| Background, biogenic, fires | 4.58 | 4.76 | −0.19 | −7% |
| Area sources (solvents, commercial cooking, fuel use) | 3.90 | 3.29 | 0.61 | 23% |
| Non-road (construction, ships, rail, airports) | 2.61 | 1.82 | 0.79 | 29% |
| On-road vehicles | 2.18 | 1.53 | 0.65 | 24% |
| Point sources (factories, power plants) | 1.16 | 0.77 | 0.39 | 15% |
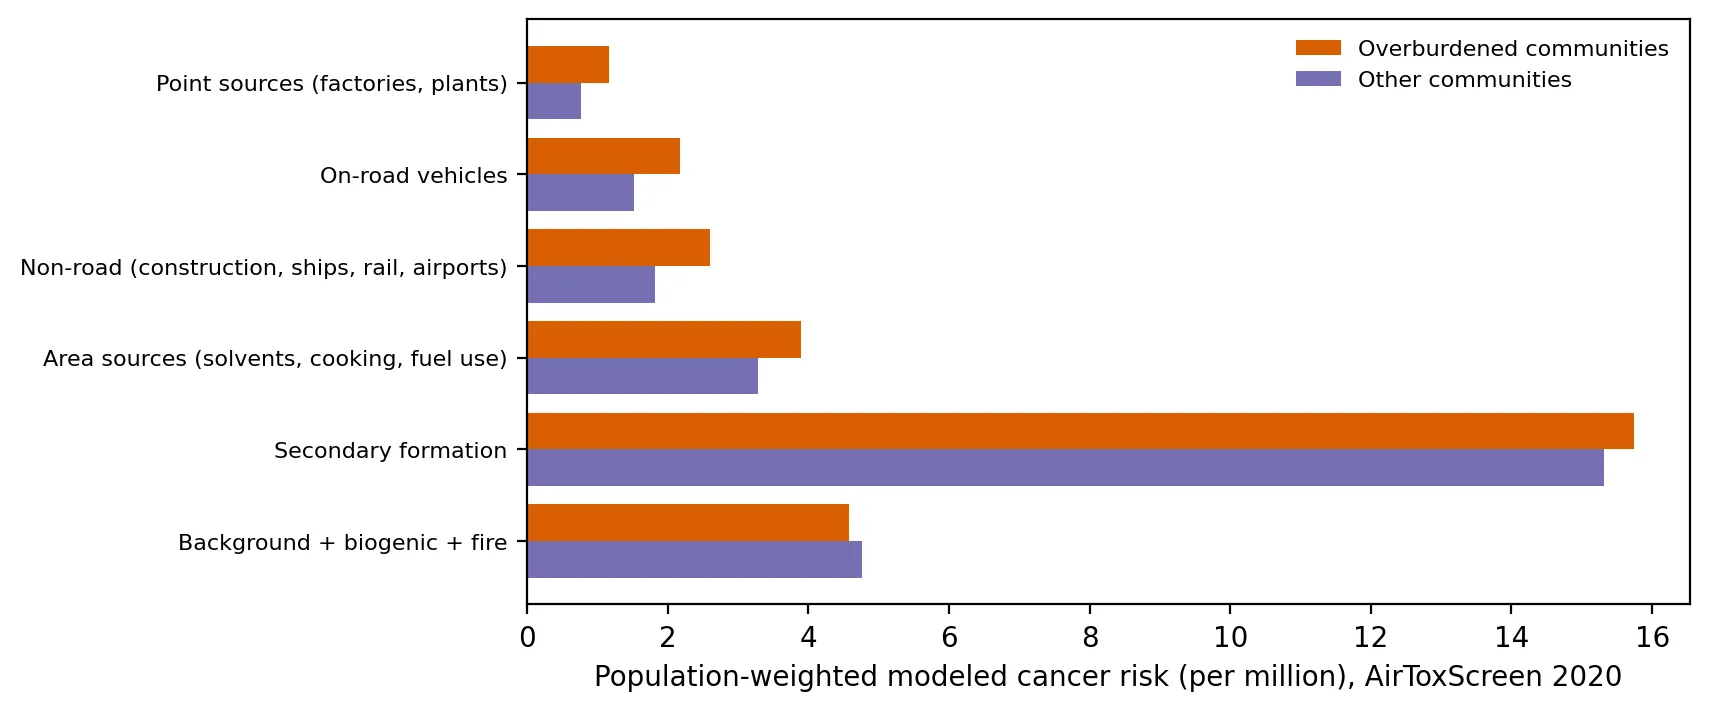 Figure 1. The cancer risk gap comes from local sources, while secondary formation and background are about the same for everyone.
About two-thirds of modeled risk comes from secondary formation and background, which are nearly the same for everyone. The gap comes almost entirely from local sources. Adding up point, on-road, non-road, and area sources, OBC residents face about 9.9 per million versus 7.4 for others, roughly 33% higher. The single biggest contributor is non-road equipment: construction machinery, ships, locomotives, and airport activity, which concentrate around ports, rail yards, and Newark Airport.
This pattern matches what my earlier posts found. Regional pollutants like ozone are widely shared (my 2024 ozone post), while locally emitted pollution, like truck traffic (my warehouse boom post), concentrates in overburdened communities.
Geography
By county, modeled risk was highest in Salem (33.4 per million), Union (31.1), Middlesex, Camden, and Hudson (about 30 each).
An important gap in the data
AirToxScreen does not include cancer risk from diesel particulate matter, because EPA has not set a cancer potency value for it, even though diesel exhaust is classified as a known human carcinogen. Since diesel exposure is higher in overburdened communities, the true local-source gap is likely larger than these numbers show.
Why this matters on Earth Day 2026
Air toxics regulation often targets individual facilities. This analysis suggests that the disparity in New Jersey is driven by many dispersed local sources, including ports, rail, construction, vehicles, and small commercial operations, more than by any single smokestack. Reducing it will take policies aimed at those sources, such as cleaner port and construction equipment, along with facility permits.
Limitations
- Modeled, not measured. AirToxScreen combines emissions inventories with dispersion models, so local errors are possible.
- 2020 emissions, an unusual pandemic year with reduced traffic.
- Rounded totals. Block-level total risk is reported in whole numbers, so threshold counts (such as “above 30”) are sensitive to rounding.
- Diesel PM excluded, as noted above.
Code project (Level 4): cluster bootstrap and source decomposition
Goal: Compare modeled air toxics cancer risk between OBC and non-OBC residents, with uncertainty, and identify which sources drive the gap.
Data: EPA AirToxScreen 2020, Cancer risk by block and source group (EPA Region 2 file; New Jersey rows); NJDEP OBC list in effect on the cutoff date.
Method:
- Extract New Jersey’s 113,212 populated blocks from the Region 2 file.
- Group about 40 source columns into six categories.
- Link blocks to block groups (first 12 digits of the block ID) and to OBC status.
- Calculate population-weighted means and the difference.
- Cluster bootstrap: resample block groups with replacement, recompute the difference 2,000 times, and take the 95% interval.
- Decompose the gap by source category.
for _ in range(2000):
    so, sn = obc_bgs.sample(len(obc_bgs), replace=True), other_bgs.sample(len(other_bgs), replace=True)
    diffs.append(so.risk_pop.sum() / so["pop"].sum() - sn.risk_pop.sum() / sn["pop"].sum())
New skills: cluster bootstrapping (resampling at the right level), and decomposing a difference into components.
Data and methods
Data sources
- EPA AirToxScreen 2020, *Cancer risk by block and source group* (EPA Region 2 file; New Jersey rows); NJDEP OBC list in effect on the cutoff date.
The analysis was done in Python with public data. The full code, its data, and every figure it produces are in the code project below.
References
- U.S. Environmental Protection Agency. (n.d.-a). AirToxScreen. https://www.epa.gov/AirToxScreen
- U.S. Environmental Protection Agency. (n.d.-b). AirToxScreen limitations. https://www.epa.gov/AirToxScreen/airtoxscreen-limitations
- U.S. Environmental Protection Agency. (n.d.-c). AirToxScreen frequent questions. https://www.epa.gov/AirToxScreen/airtoxscreen-frequent-questions
- U.S. Environmental Protection Agency. (2024). 2020 AirToxScreen assessment results. https://www.epa.gov/AirToxScreen/2020-airtoxscreen-assessment-results
- U.S. Environmental Protection Agency. (2024). AirToxScreen 2020: Cancer risk by block and source group, Region 2 [Data set]. https://gaftp.epa.gov/rtrmodeling_public/AirToxScreen/2020/Cancer/BySource/
- New Jersey Department of Environmental Protection. (2026). Environmental Justice (EJ) Law Combined Stressor Summary (Current) [Data set]. https://www.arcgis.com/home/item.html?id=8f1eeb5074d147af8ab3e5e5a4f72d2b