
When It Rains, It Pours Sewage: Combined Sewer Overflows in New Jersey
Abstract. In New Jersey’s oldest cities, a single set of pipes carries both sewage and stormwater. When it rains, those pipes overflow, sending untreated sewage into the Passaic, Hudson, Delaware, and other rivers through about 200 permitted outfalls. Using every discharge monitoring report filed by New Jersey’s 21 combined sewer permit holders from 2023 to 2025, I find that the median outfall discharged on 55 days per year, and 84% of outfall-months included at least one overflow. Overflow activity rises steadily with rainfall (r = 0.63), and the apparent decline from 2023 to 2025 closely tracks drier weather rather than clear evidence of reduced overflows. The burden falls almost entirely on overburdened communities: 92% of the 655,000 people living within half a mile of an active outfall live in an overburdened community, and residents of those communities are eight times as likely as other New Jerseyans to live that close.
1. Two pipes in one
Most American cities built after the early 20th century have separate pipes: one for sewage, which goes to a treatment plant, and one for stormwater, which drains to rivers. Older cities often built combined sewer systems, in which a single pipe carries both. On dry days, everything goes to the treatment plant. During rain or snowmelt, the volume can exceed the capacity of the pipes or the plant. To prevent sewage from backing up into streets and basements, the system is designed to overflow at combined sewer overflow (CSO) outfalls, releasing a mix of stormwater and raw sewage directly into rivers and bays.
These overflows contain bacteria, viruses, and other pathogens, along with trash, oil, and chemicals from streets. They can make rivers unsafe for fishing, boating, or swimming, and in some neighborhoods, overloaded combined sewers also cause sewage to back up into streets and basements during storms.
New Jersey has one of the largest concentrations of combined sewers in the country. According to NJDEP, 21 permit holders operate about 207 active CSO outfalls, concentrated in Newark, Jersey City, Paterson, Elizabeth, Bayonne, Perth Amboy, the North Hudson communities, Camden, and a few other cities. One widely cited estimate puts statewide overflows at about 23 billion gallons per year, although that figure is several years old (Jersey Water Works, 2018).
2. The long road to control
The federal government addressed CSOs in its 1994 CSO Control Policy. Under its “presumption approach,” a system is generally considered adequately controlled if it captures at least 85% of combined sewage volume during wet weather for treatment, or limits overflows to about four to six events per year.
New Jersey moved slowly. In 2015, NJDEP issued new permits requiring every combined sewer system to develop a Long-Term Control Plan (LTCP) by 2020 (Rutgers CUPR, 2015). The Passaic Valley Sewerage Commission submitted a regional plan for its member cities, including Newark, Paterson, and Jersey City, in 2020, targeting the 85% capture standard. Camden’s plan, developed with the Camden County MUA, aims to reduce overflows to no more than 15% of annual flow (CCMUA, n.d.). The price is high. Estimates of the cost to control New Jersey’s CSOs range from $3 billion to $5 billion, and Rutgers researchers have reported that Camden County’s system overflows to local waterways an average of 76 times per year (Rutgers NJ Environmental Digital Library, n.d.; Tri-State Infrastructure News, 2024).
These are multi-decade projects: storage tunnels, treatment plant expansions, sewer separation, and green infrastructure such as rain gardens and porous pavement that keep stormwater out of the pipes. The question for residents is whether overflows are actually declining.
3. Data and methods
Full code is in code/.
- Outfalls. NJDEP’s map of CSO outfalls lists 211 points, with permit numbers, receiving waters, and status; 207 are active.
- Overflow activity. Each permit holder files monthly discharge monitoring reports (DMRs). I downloaded every DMR for 2023–2025 from EPA’s ECHO database. For each outfall, permits require a monthly “duration of discharge,” which New Jersey permittees report as a whole number of days. I treat it as the number of days in the month on which the outfall discharged. Permittees also report monthly rainfall.
- Who lives nearby. I counted 2020 Census population within half a mile of each active outfall and classified each block by overburdened community status (see Post 1).
4. Results
Overflows are routine, not rare
For 205 active outfalls with reported data, the median outfall discharged on 55 days per year, and 83 outfalls discharged on more than 60 days per year. In 84% of outfall-months, the outfall discharged at least once. Days with a discharge are not the same as overflow events, since one storm can cause discharges over two days, but 55 days per year is far above the four to six annual events used as a benchmark in the federal CSO policy.
The permit holders with the most total outfall-days per year were Camden City (1,483 across 22 outfalls), Elizabeth (1,314), Perth Amboy (1,288), Newark (1,229), Jersey City MUA (1,149), Bayonne (984), and Paterson (884). The single most active outfalls, according to their own reports, were in Bayonne on the Kill Van Kull (213 days per year), Elizabeth on the Elizabeth River (145), and Perth Amboy on the Arthur Kill (122). By receiving water, the Passaic River received the most overflow activity by far (2,362 outfall-days per year), followed by the Hudson, Delaware, Elizabeth, Hackensack, and Raritan rivers.
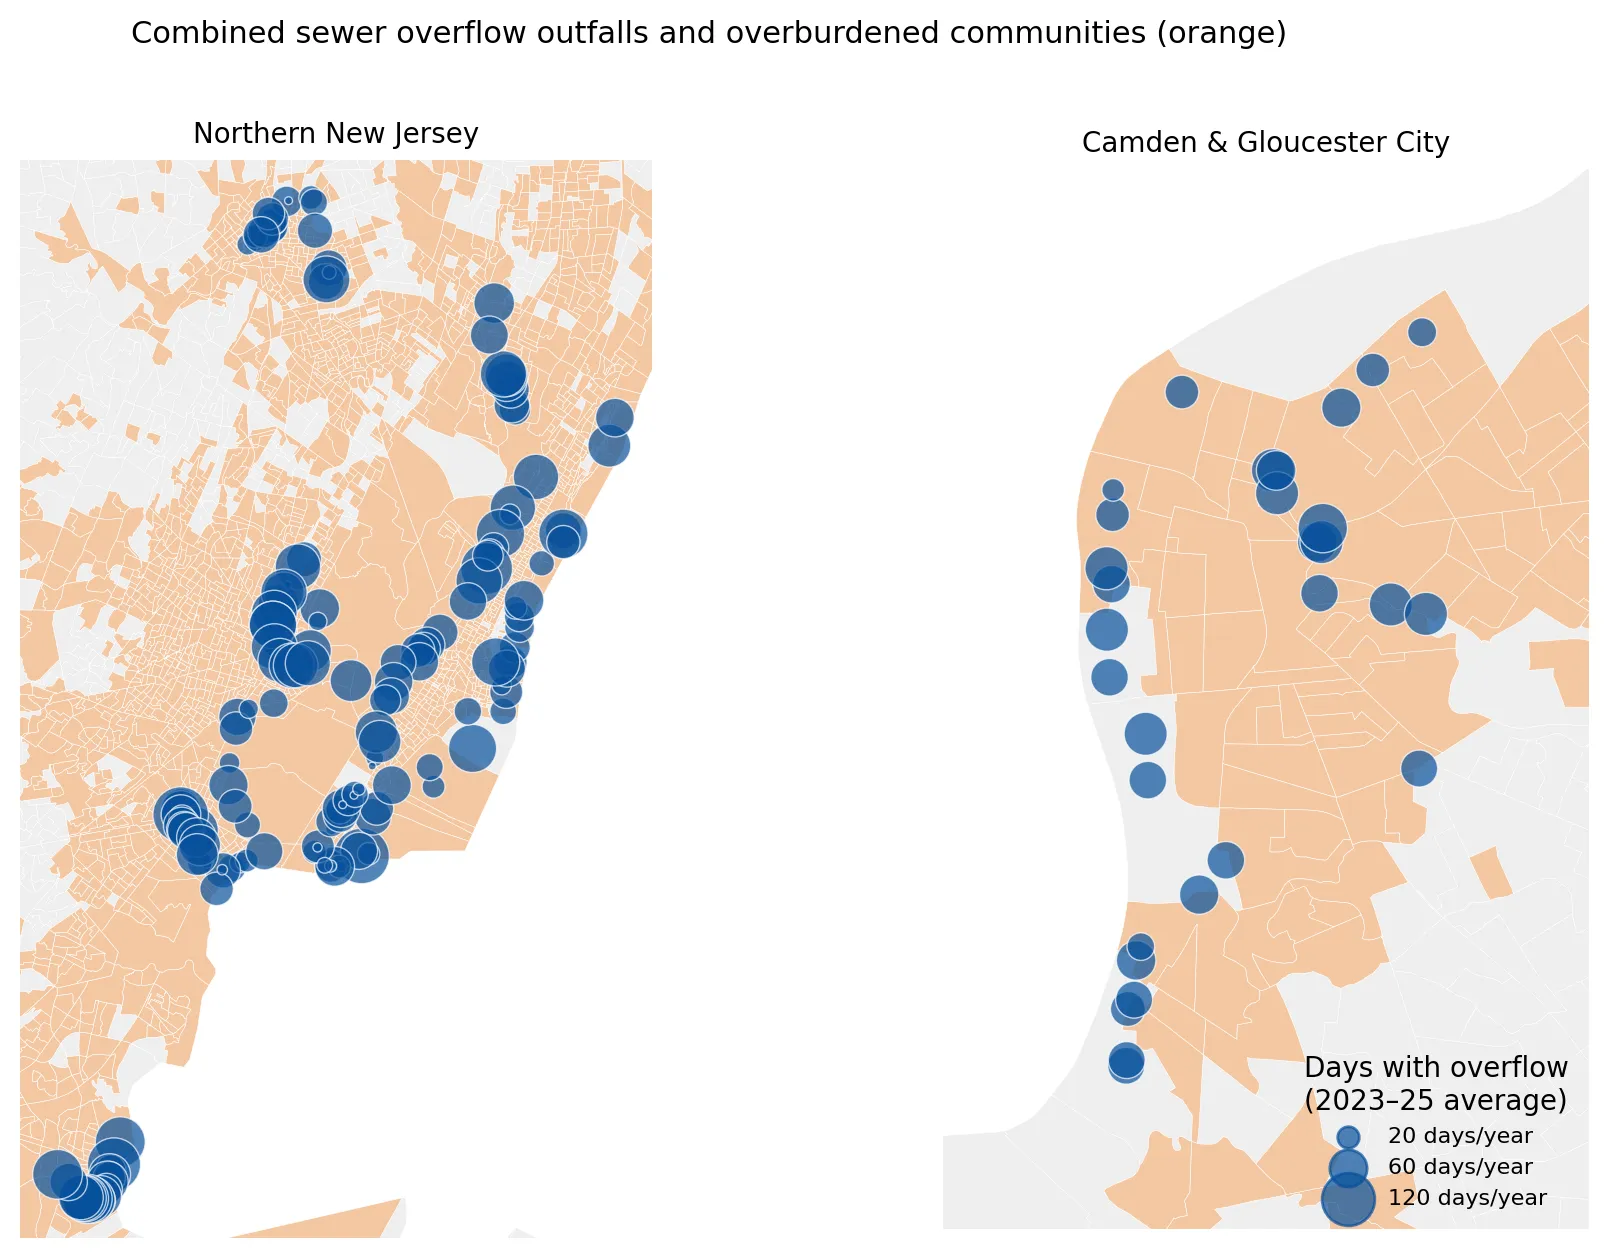 Figure 1. Active CSO outfalls, sized by average days with overflow per year (2023–2025), and overburdened communities (orange).
Rain drives overflows
Monthly overflow activity rises with rainfall (correlation r = 0.63 across 719 permit-months, Figure 2). In months with less than 2 inches of rain, the average outfall discharged on about 2 days. In months with more than 5 inches, it discharged on about 7 days.
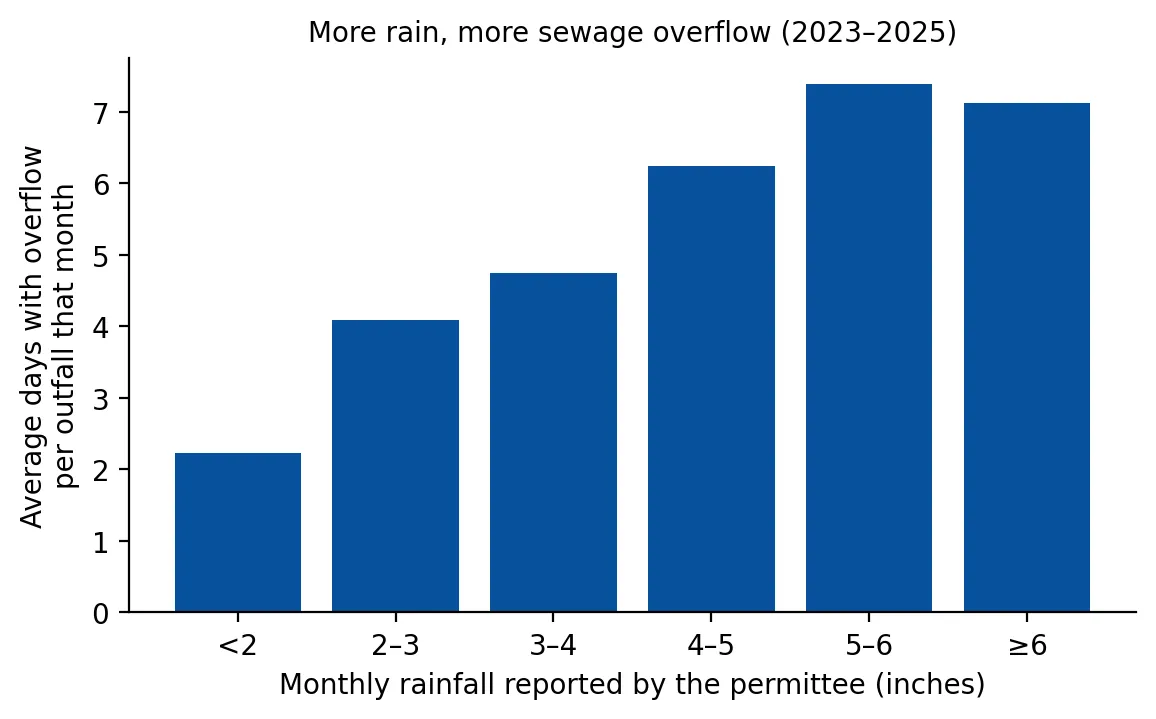 Figure 2. Average days with overflow per outfall, by monthly rainfall reported by the permittee.
That relationship matters for interpreting trends. Total outfall-days fell from 12,712 in 2023 to 9,870 in 2025, a 22% decline. But the average monthly rainfall reported by permittees also fell, from 4.3 inches in 2023 to 3.0 inches in 2025. Overflow days per outfall fell roughly in proportion. The data so far do not show a clear improvement beyond what drier weather would explain. Most major LTCP projects are still under construction, and the effect of these investments will only be visible over a longer record and after adjusting for rainfall.
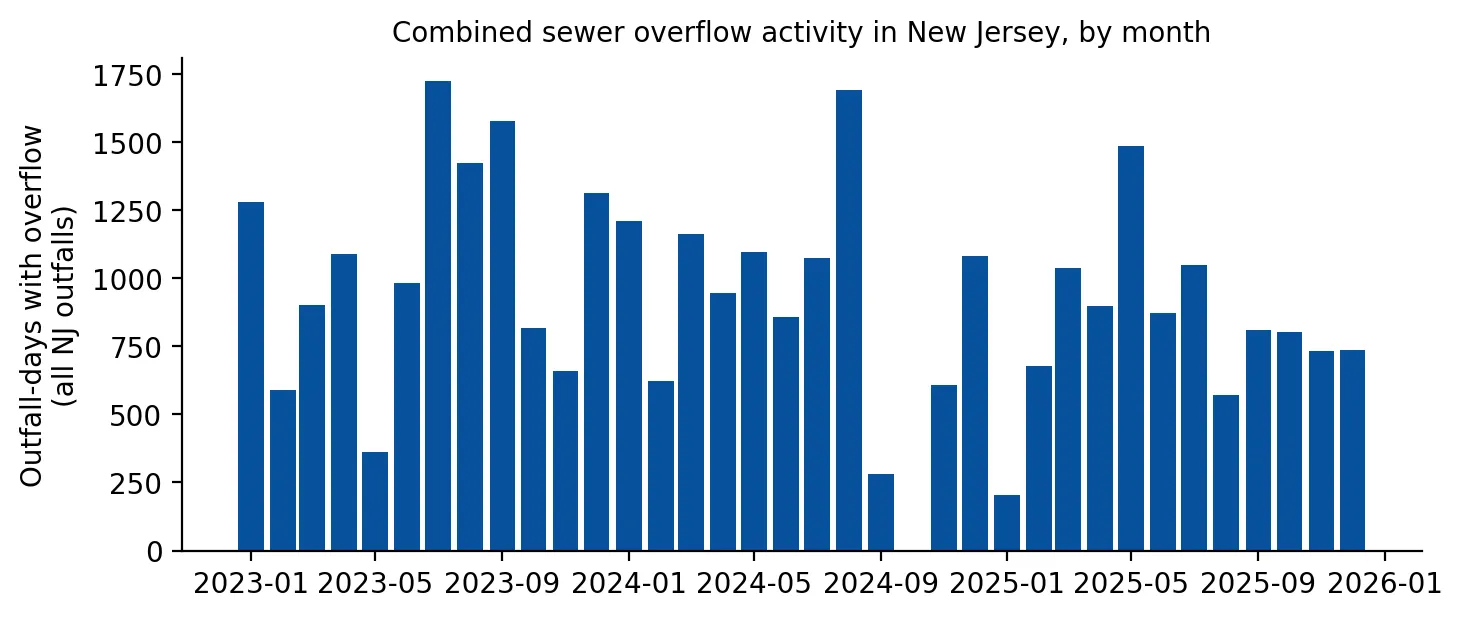 Figure 3. Total outfall-days with overflow across New Jersey, by month, 2023–2025.
Who lives near the outfalls
About 655,000 New Jerseyans live within half a mile of an active CSO outfall. Of them, 601,000 (92%) live in overburdened communities. Put differently:
| Living within 1/2 mile of an active CSO outfall | |
|---|---|
| Residents of overburdened communities | 11.3% |
| Other residents | 1.4% |
| Ratio | 8.1× |
Similarly, 92% of outfalls sit inside overburdened community block groups, and they account for 92% of overflow days. This is not surprising. Combined sewers are a feature of New Jersey’s oldest industrial cities, which are also where the state’s overburdened communities are concentrated. It does mean that the costs of slow progress, including polluted waterfronts, closed fishing and recreation, and sewage backups, fall overwhelmingly on these communities. CSOs are one of the 26 stressors in New Jersey’s Environmental Justice Law (Post 1). Because CSO projects primarily reduce pollution, the law’s rules specifically identify them as the kind of project that can serve a “compelling public interest” in an overburdened community.
5. Who pays?
LTCP projects are financed largely by local sewer rates and state loans from the New Jersey Infrastructure Bank. That creates a difficult equity problem: some of the poorest cities in the state, including Camden, Paterson, Newark, and Perth Amboy, are being asked to pay for billions of dollars in sewer upgrades for systems built a century ago. Rate increases fall hardest on low-income households, and green infrastructure, which can also reduce flooding and heat (see Post 2), competes for limited municipal capital budgets. How much of the cost is shared statewide, through state and federal grants rather than local rates, will shape both the pace of progress and its fairness.
6. Limitations
- Days, not volume or events. DMRs report days with discharge per month, not gallons or the number of separate events. Some permits report volume or event counts elsewhere, but not consistently across all 21 permittees.
- Self-reported data. Discharge monitoring relies on permittee reporting; outfall metering methods vary.
- Short record. Three years is too short to separate long-term trends from weather. A proper evaluation would model overflows as a function of storm-by-storm rainfall.
- Proximity is not exposure. Living near an outfall does not mean contact with sewage; exposure depends on recreation, flooding, and backups.
7. Conclusion
New Jersey’s combined sewer systems overflow on dozens of days each year, into rivers that run past the state’s most overburdened neighborhoods. More than nine in ten people living near an outfall live in an overburdened community. Long-Term Control Plans promise major reductions, but three years of monitoring data do not yet show improvement beyond what drier weather explains. As climate change brings heavier downpours to the Northeast, the gap between what these century-old systems were designed for and what they now face will widen, which makes timely, fairly financed construction all the more important.
Data and methods
The analysis was done in Python with public data. The full code, its data, and every figure it produces are in the code project below.
References
- Camden County Municipal Utilities Authority. (n.d.). Long term control plan. https://www.ccmua.org/?p=6602
- Jersey Water Works. (2018). New Jersey combined sewer system fact sheet. https://cms.jerseywaterworks.org/wp-content/uploads/2018/08/NJ-CSOs-Fact-Sheet-UPDATED.pdf
- New Jersey Department of Environmental Protection. (2026). NJPDES combined sewer overflow (CSO) outfalls [Data set]. https://mapsdep.nj.gov/arcgis/rest/services/Features/Utilities/MapServer/0
- Rutgers Center for Urban Policy Research. (2015). New permit system requires long-term CSO discharge reduction plans and enhanced public outreach. https://cupr.rutgers.edu/999-2/
- Rutgers New Jersey Environmental Digital Library. (n.d.). Study shows Camden County sewage flows into local waterways 76 times a year on average. https://njedl.rutgers.edu/news/study-shows-camden-county-sewage-flows-local-waterways-76-times-year-average
- Tri-State Infrastructure News. (2024). NJ water infrastructure report card. https://tristateinfrastructurenews.com/nj-water-infrastructure-report-card/
- U.S. Environmental Protection Agency. (1994). Combined sewer overflow (CSO) control policy. Federal Register, 59(75), 18688–18698.
- U.S. Environmental Protection Agency. (2026). ECHO effluent charts: Discharge monitoring report data for New Jersey CSO permits, 2023–2025 [Data set]. https://echo.epa.gov/