
The Map EPA Took Down: What EJScreen's Last Data Showed About New Jersey
A tool disappears
For about a decade, anyone could open EPA’s EJScreen, type in an address, and see how that neighborhood compared on pollution and demographics. Students, reporters, community groups, and state agencies all used it. On February 5, 2025, EPA removed EJScreen and its download pages from its website without explanation (EDGI, 2025; SEJ, 2025). Volunteers had already saved the data, and a coalition called Public Environmental Data Partners rebuilt the tool online (SEJ, 2025).
When a tool like this disappears, it’s worth asking what it showed. In this post, I use the final version of EJScreen’s data (version 2.32, released in August 2024), saved by the Internet Archive on the day it was taken down, to test the claim at the center of this project: pollution in New Jersey falls more heavily on communities of color.
Data
EJScreen combines more than a dozen environmental indicators, built from EPA’s own air models, facility databases, and satellite data, with Census demographics for every block group in the country. I kept New Jersey’s 6,524 block groups with residents and compared each of 13 environmental indicators with the share of residents who are people of color.
Method: rank correlation
Spearman’s rank correlation (ρ) measures whether two things rise together. It ranks every block group on both measures and checks how well the rankings line up: +1 means a perfect match, 0 means no relationship, and −1 means they move in opposite directions. Spearman’s ρ works well for pollution data, which often has a few extreme values.
Findings
12 of 13 indicators rise with the share of people of color
| Environmental indicator | Spearman ρ with % people of color | Most diverse fifth of neighborhoods ÷ least diverse fifth |
|---|---|---|
| Traffic nearby | 0.59 | 3.7× |
| Hazardous waste facilities nearby | 0.58 | 4.9× |
| Nitrogen dioxide (NO2) | 0.57 | 2.0× |
| Diesel particulate matter | 0.56 | 2.1× |
| Underground storage tanks (incl. leaking) | 0.53 | 7.1× |
| Fine particles (PM2.5) | 0.50 | 1.1× |
| Superfund sites nearby | 0.45 | 3.3× |
| Chemical accident risk facilities nearby | 0.40 | 3.2× |
| Ozone | 0.39 | 1.0× |
| Industrial wastewater discharges | 0.37 | 2.3× |
| Toxic air releases | 0.29 | 1.5× |
| Lead paint risk (pre-1960 housing) | 0.21 | 1.5× |
| Drinking water non-compliance | −0.05 | — |
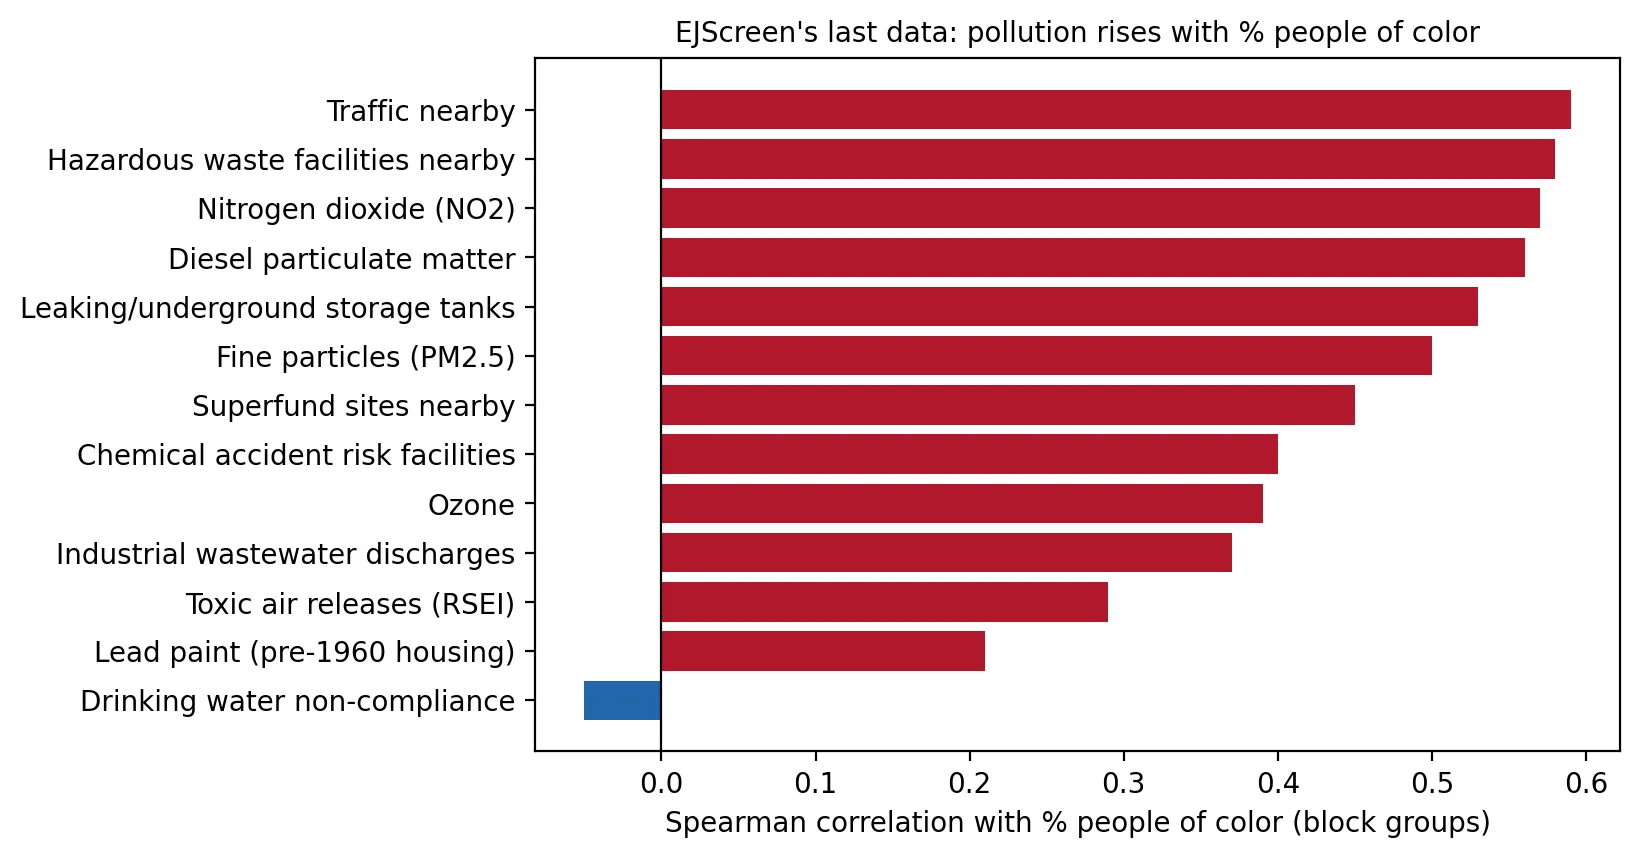 Figure 1. Twelve of 13 EJScreen indicators rise with the share of people of color in New Jersey neighborhoods.
Twelve of the thirteen indicators are positively correlated with the share of people of color, all with p < 0.001. The only exception is drinking water non-compliance, which shows no relationship either way.
The differences are large. Compared with the fifth of New Jersey neighborhoods with the fewest people of color, the fifth with the most have:
- 4.9× as much nearby hazardous waste activity;
- 3.7× as much nearby traffic;
- 3.3× as much proximity to Superfund sites;
- 2.1× the diesel particulate matter; and
- 2.0× the nitrogen dioxide, a pollutant from vehicle exhaust that inflames the airways.
For PM2.5 and ozone, which spread across whole regions, the correlations are strong but the differences in amount are small (about 10% for PM2.5).
A steady staircase
| Neighborhoods grouped by % people of color | Avg. % people of color | Diesel PM (µg/m³) | NO2 (ppb) |
|---|---|---|---|
| Fewest | 8% | 0.18 | 6.2 |
| 2nd | 23% | 0.22 | 7.3 |
| Middle | 41% | 0.28 | 8.7 |
| 4th | 66% | 0.35 | 10.7 |
| Most | 92% | 0.38 | 12.3 |
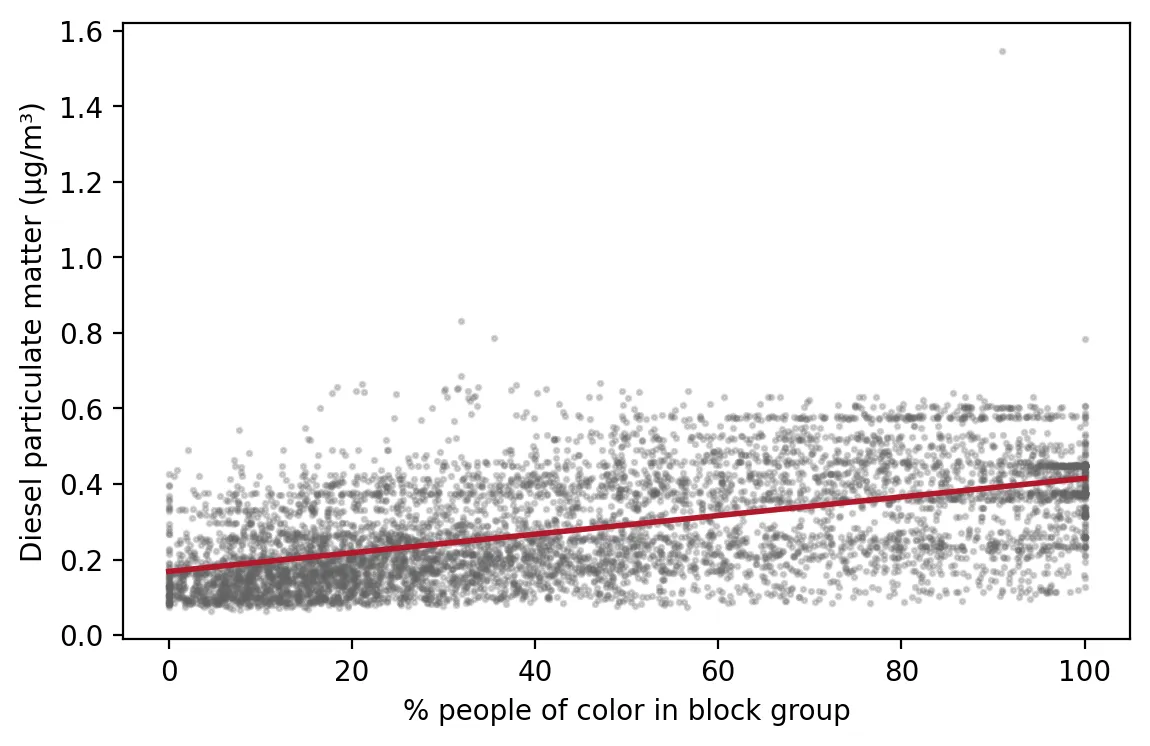 Figure 2. Diesel particulate matter rises steadily as neighborhoods have a larger share of people of color.
Pollution doesn’t jump at one threshold. It rises step by step as neighborhoods become more diverse. That steady pattern is hard to explain as a coincidence.
Overburdened communities, too
Using NJDEP’s overburdened community list in effect in May 2025, overburdened communities averaged 2.8× the nearby hazardous waste activity, 2.4× the chemical accident risk, 2.3× the traffic, and 2.2× the Superfund proximity of other neighborhoods.
Why this matters
EJScreen didn’t create these patterns. It made them visible to anyone with an internet connection. The data still exist because people saved them, and they show the same thing New Jersey’s Legislature declared in 2020: pollution here is not shared equally. Without public tools like this, it becomes harder for communities to see, and prove, what they’re living with.
Limitations
- Screening data, not health data. EJScreen indicators estimate exposure or proximity. They don’t measure illness.
- Correlation is not cause. This shows where pollution and communities of color overlap, not why.
- Data age. Version 2.32 uses 2018–2022 Census estimates and indicator data from several earlier years.
Code project (Level 2): measuring a relationship
Goal: Measure how strongly each EJScreen indicator rises with the share of people of color in New Jersey neighborhoods.
Data: EJScreen 2.32 block-group file with state percentiles (Internet Archive copy, February 5, 2025), New Jersey rows; NJDEP OBC list (version effective January 31, 2025).
Steps:
- Load the file and keep block groups with residents.
- For each indicator, compute Spearman’s ρ with % people of color.
- Split neighborhoods into five equal groups (quintiles) by % people of color and compare averages.
- Compare overburdened communities with other neighborhoods.
- Plot the correlations and a scatter plot with a trend line.
from scipy.stats import spearmanr
rho, p = spearmanr(e["DSLPM"], e["PEOPCOLORPCT"])
quintile = pd.qcut(e.PEOPCOLORPCT.rank(method="first"), 5, labels=False)
print(e.groupby(quintile).DSLPM.mean())
New skills: rank correlation, p-values, quintiles, and trend lines.
Data and methods
Data sources
- EJScreen 2.32 block-group file with state percentiles (Internet Archive copy, February 5, 2025), New Jersey rows; NJDEP OBC list (version effective January 31, 2025).
The analysis was done in Python with public data. The full code, its data, and every figure it produces are in the code project below.
References
- Environmental Data & Governance Initiative. (2025, February 12). EPA removes EJScreen from its website. https://envirodatagov.org/epa-removes-ejscreen-from-its-website/
- New Jersey Department of Environmental Protection. (2025). Environmental Justice EJ Law Combined Stressor Summary 20250131 to 20260330 [Data set]. https://www.arcgis.com/home/item.html?id=8a9ae7bae7a0458fb0f8d3759b145257
- Society of Environmental Journalists. (2025, February 13). "EPA removes EJScreen from its website" (but not from the web). https://www.sej.org/headlines/epa-removes-ejscreen-its-website-not-web
- U.S. Environmental Protection Agency. (2024). EJScreen 2.32 block group data with state percentiles [Data set; Internet Archive copy of February 5, 2025]. https://web.archive.org/web/20250205213739/https://gaftp.epa.gov/ejscreen/2024/2.32_August_UseMe/EJSCREEN_2024_BG_StatePct_with_AS_CNMI_GU_VI.csv.zip