
Where Do You Draw the Line? How Three Numbers Decide Who Is 'Overburdened'
Context
January 2026 brought two turning points for New Jersey environmental policy. On January 5, the Appellate Division upheld NJDEP’s environmental justice rules (my post on the appeals court ruling). On January 20, Mikie Sherrill was sworn in as governor, and her first executive order paused utility rate increases (ABC7, 2026), a reminder of the electricity price jump discussed in my power plant post.
Both developments raise a question underneath every environmental justice policy: who counts? New Jersey’s law answers with three numbers. A block group is overburdened if at least 35% of households are low-income, at least 40% of residents are minority, or at least 40% of households have limited English proficiency (New Jersey Legislature, 2020). Those thresholds were political choices. How much does the map depend on them?
Method
NJDEP’s dataset includes each block group’s low-income, minority, and limited-English percentages from the American Community Survey. I first recreated the official list from these percentages (my version matched NJDEP’s 100%), then changed one threshold at a time and recounted. This is a sensitivity analysis: testing how much a result depends on assumptions.
Findings
The minority threshold drives the size of the map
| Low-income threshold (others fixed) | % of residents in an OBC | Minority threshold (others fixed) | % of residents in an OBC | |
|---|---|---|---|---|
| 25% | 60.3% | 30% | 66.9% | |
| 30% | 58.0% | 35% | 61.5% | |
| 35% (current) | 56.5% | 40% (current) | 56.5% | |
| 40% | 55.6% | 50% | 48.0% | |
| 50% | 54.8% | 60% | 41.7% |
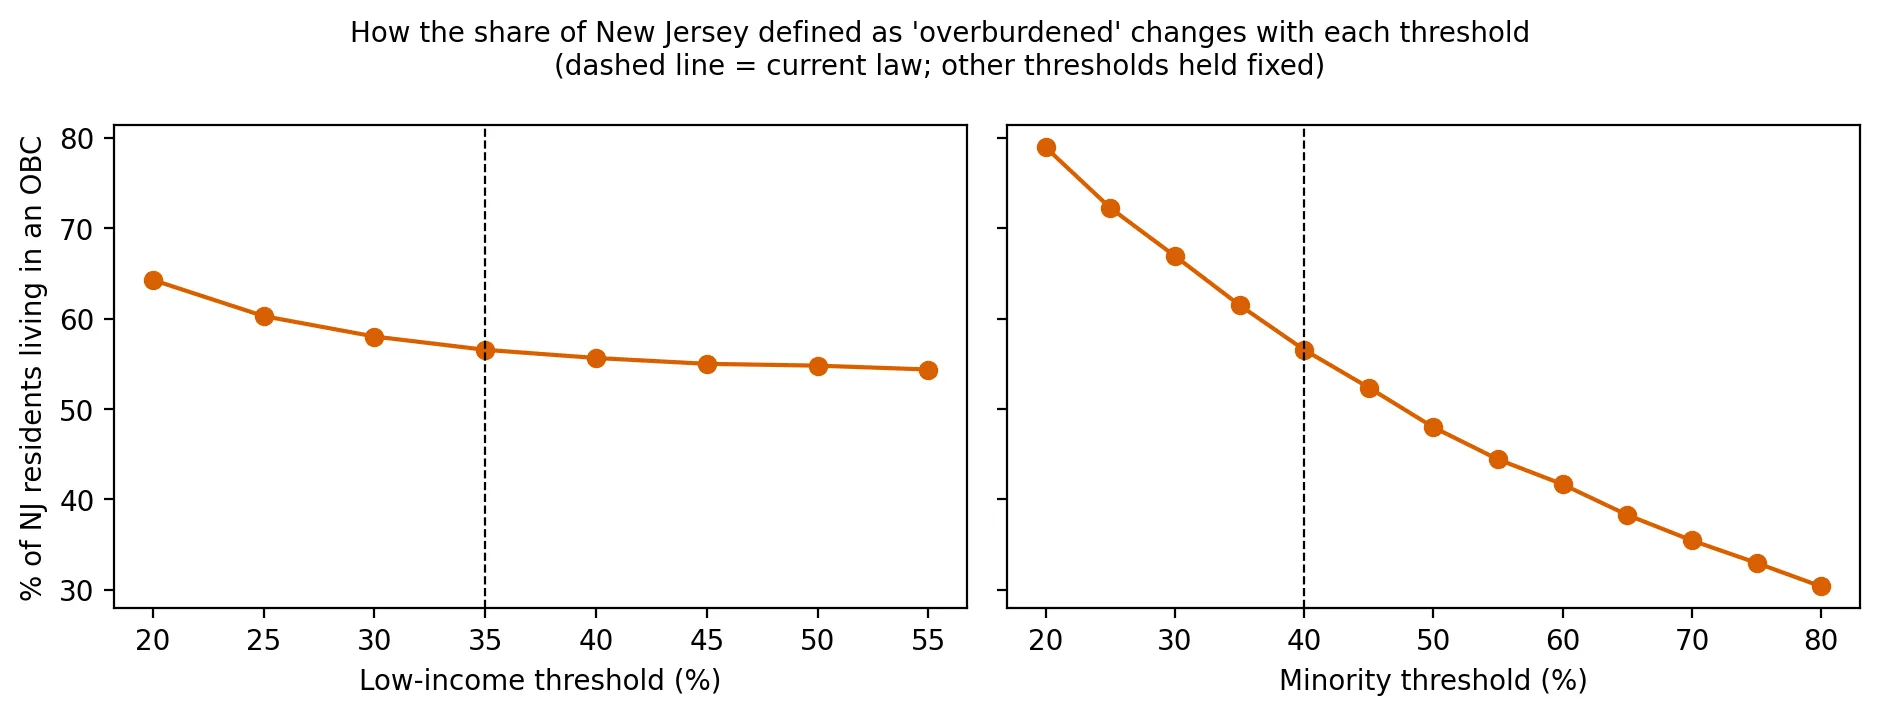 Figure 1. The share of residents counted as overburdened is far more sensitive to the minority threshold than to the low-income threshold.
Changing the low-income threshold barely matters: moving it from 35% to 50% shrinks the OBC population share by less than 2 points. That’s because most low-income block groups also meet the minority criterion. Changing the minority threshold matters a lot: each 10-point change moves the share by about 8 to 10 points.
60% of OBCs qualify by the minority criterion alone
2,181 of 3,637 OBCs (60%) qualify only because at least 40% of residents are minority. In those block groups, the median share of low-income households is just 15%, far below the 35% income threshold. Many are middle-income suburbs with large Asian American, Latino, or Black populations.
That is not an error. The law’s findings explicitly cite the history of siting pollution in communities of color, and research shows that race predicts pollution exposure even after accounting for income (the introduction). But it does mean that New Jersey’s definition is much broader than income-based definitions used elsewhere.
Alternative definitions
| Definition | Block groups | % of NJ residents |
|---|---|---|
| Current law (35% / 40% / 40%) | 3,637 | 56.5% |
| Minority threshold raised to 50% | 3,075 | 48.0% |
| Income only (≥ 35% low-income) | 1,404 | 21.9% |
| Income and minority (both required) | 1,200 | 18.8% |
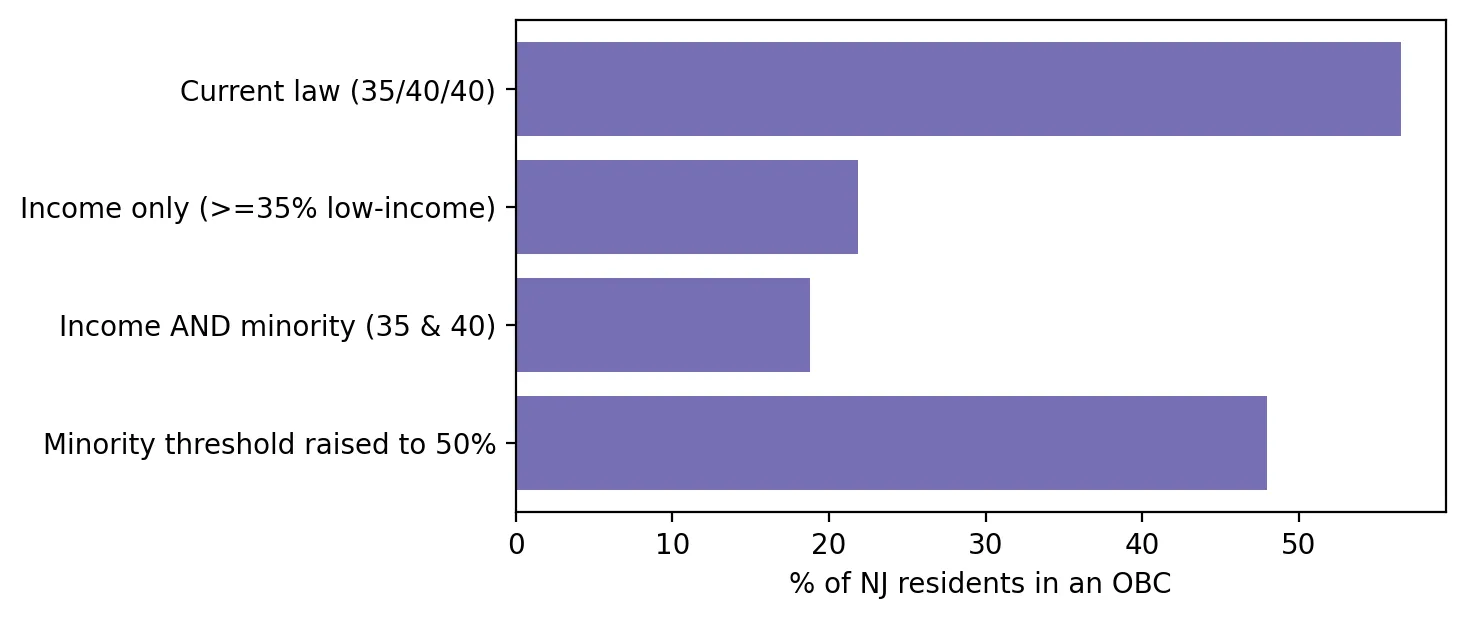 Figure 2. Alternative definitions of an overburdened community would change the share of residents covered, from about 19% to 56%.
For comparison, California identifies “disadvantaged communities” using CalEnviroScreen, which ranks census tracts on a combination of pollution and population characteristics and designates roughly the highest-scoring quarter (OEHHA, n.d.). New Jersey instead uses demographics to define the community and then measures pollution separately.
Many block groups sit near the line
861 block groups (13%) are within 3 percentage points of at least one threshold. The percentages come from survey samples, and for block groups the margins of error are often larger than 3 points (U.S. Census Bureau, n.d.). For these communities, OBC status can depend partly on sampling chance and can flip from one update to the next.
Why this matters
Debates about environmental justice policy often focus on what the law requires. This analysis shows that who it covers can matter just as much. Small changes to three thresholds would shift legal protections for hundreds of thousands of people. Any future amendment, whether to narrow the definition or to add measures like health outcomes, should be evaluated with exactly this kind of analysis.
Limitations
- One threshold at a time. Changing several thresholds together would interact in more complex ways.
- Margins of error are not modeled directly. NJDEP’s file does not include ACS margins of error, so “near the line” is a rough indicator.
- Coverage, not outcomes. Being covered by the law does not guarantee a facility will be denied or conditioned.
Code project (Level 3): sensitivity analysis
Goal: Recreate the OBC list from its definition and test how it changes with different thresholds.
Data: NJDEP EJ Law data (version effective Jan 31, 2025 – Mar 30, 2026): low-income %, minority %, limited-English %, population.
Method:
- Check the units (percent or fraction?) before applying thresholds.
- Write a function
obc(li, mi, le)that applies the statutory test, and confirm it reproduces NJDEP’s list. - Loop over threshold values and record the number of block groups and the population share.
- Compare alternative definitions, and count block groups within ±3 points of a threshold.
def obc(li=35, mi=40, le=40):
    return (LI >= li) | (MI >= mi) | (LE >= le)

for mi in range(20, 81, 5):
    share = g.TOTALPOP[obc(mi=mi)].sum() / g.TOTALPOP.sum()
New skill: sensitivity analysis, which asks how robust a conclusion is to the choices built into it.
Data and methods
Data sources
- NJDEP EJ Law data (version effective Jan 31, 2025 – Mar 30, 2026): low-income %, minority %, limited-English %, population.
The analysis was done in Python with public data. The full code, its data, and every figure it produces are in the code project below.
References
- ABC7 New York. (2026, January 20). Mikie Sherrill sworn in as New Jersey governor, makes good on campaign promise. https://abc7ny.com/post/mikie-sherrill-gubernatorial-inauguration-former-congresswoman-sworn-governor-aims-making-nj-affordable/18436903/
- New Jersey Legislature. (2020). P.L.2020, c.92. https://pub.njleg.gov/bills/2020/PL20/92_.PDF
- Office of Environmental Health Hazard Assessment (California). (n.d.). CalEnviroScreen. https://oehha.ca.gov/calenviroscreen
- U.S. Census Bureau. (n.d.). American Community Survey: Sample size and data quality. https://www.census.gov/programs-surveys/acs/methodology/sample-size-and-data-quality.html
- New Jersey Department of Environmental Protection. (2025). Environmental Justice (EJ) Law Combined Stressor Summary (version effective Jan 31, 2025 – Mar 30, 2026) [Data set]. https://www.arcgis.com/home/item.html?id=8a9ae7bae7a0458fb0f8d3759b145257