
A Decade of Ozone: New Jersey's Progress Has Stalled
Why look back now
Ozone season is underway. In my 2024 ozone post, I counted the days New Jersey’s monitors exceeded the federal ozone standard in 2024. One year can be misleading, because summer weather drives ozone up or down. Now that 2025 data have been certified, I looked at eleven years (2015–2025) to ask a bigger question: is New Jersey’s ozone getting better, and is it improving equally everywhere?
Ozone forms when nitrogen oxides and volatile organic compounds react in sunlight. Nationally, ozone levels have declined substantially since 1980 as vehicles and power plants got cleaner (U.S. EPA, n.d.-a). The standard is 70 parts per billion (ppb), measured as the fourth-highest daily maximum 8-hour average, averaged over three years (U.S. EPA, n.d.-b).
Data and methods
I used EPA AirData daily files for 2015–2025 (U.S. EPA, n.d.-c). For each New Jersey monitor and year, I calculated the fourth-highest day and the number of days above 70 ppb. Then I used three trend tools:
- A slope for each monitor (ppb per year).
- Kendall’s tau, a nonparametric test that asks whether values tend to rise or fall over time without assuming a straight line or normally distributed data.
- A panel regression across all monitors, with a separate baseline for each monitor (monitor fixed effects) and a year × OBC interaction to test whether trends differ for monitors in overburdened communities.
Findings
Long-term improvement
16 of 17 monitors showed declining fourth-highest values from 2015 to 2025. Across all monitors, the panel model estimates an average decline of 0.38 ppb per year (p < 0.001), about 4 ppb over the decade. The biggest declines were at Camden Spruce Street (−1.7 ppb/yr), Newark Firehouse (−1.1), and Brigantine (−0.9). Only four monitors had declines strong enough to pass the Kendall test at p < 0.05, which shows how noisy year-to-year ozone is.
But progress stalled after 2020
| Year | Highest 4th-max (ppb) | Average 4th-max (ppb) | Days any monitor > 70 ppb |
|---|---|---|---|
| 2015 | 79 | 73.2 | 32 |
| 2017 | 76 | 68.8 | 14 |
| 2019 | 71 | 66.0 | 12 |
| 2020 | 70 | 62.2 | 5 |
| 2022 | 69 | 63.9 | 8 |
| 2023 | 75 | 69.1 | 17 |
| 2024 | 78 | 68.9 | 20 |
| 2025 | 75 | 68.2 | 16 |
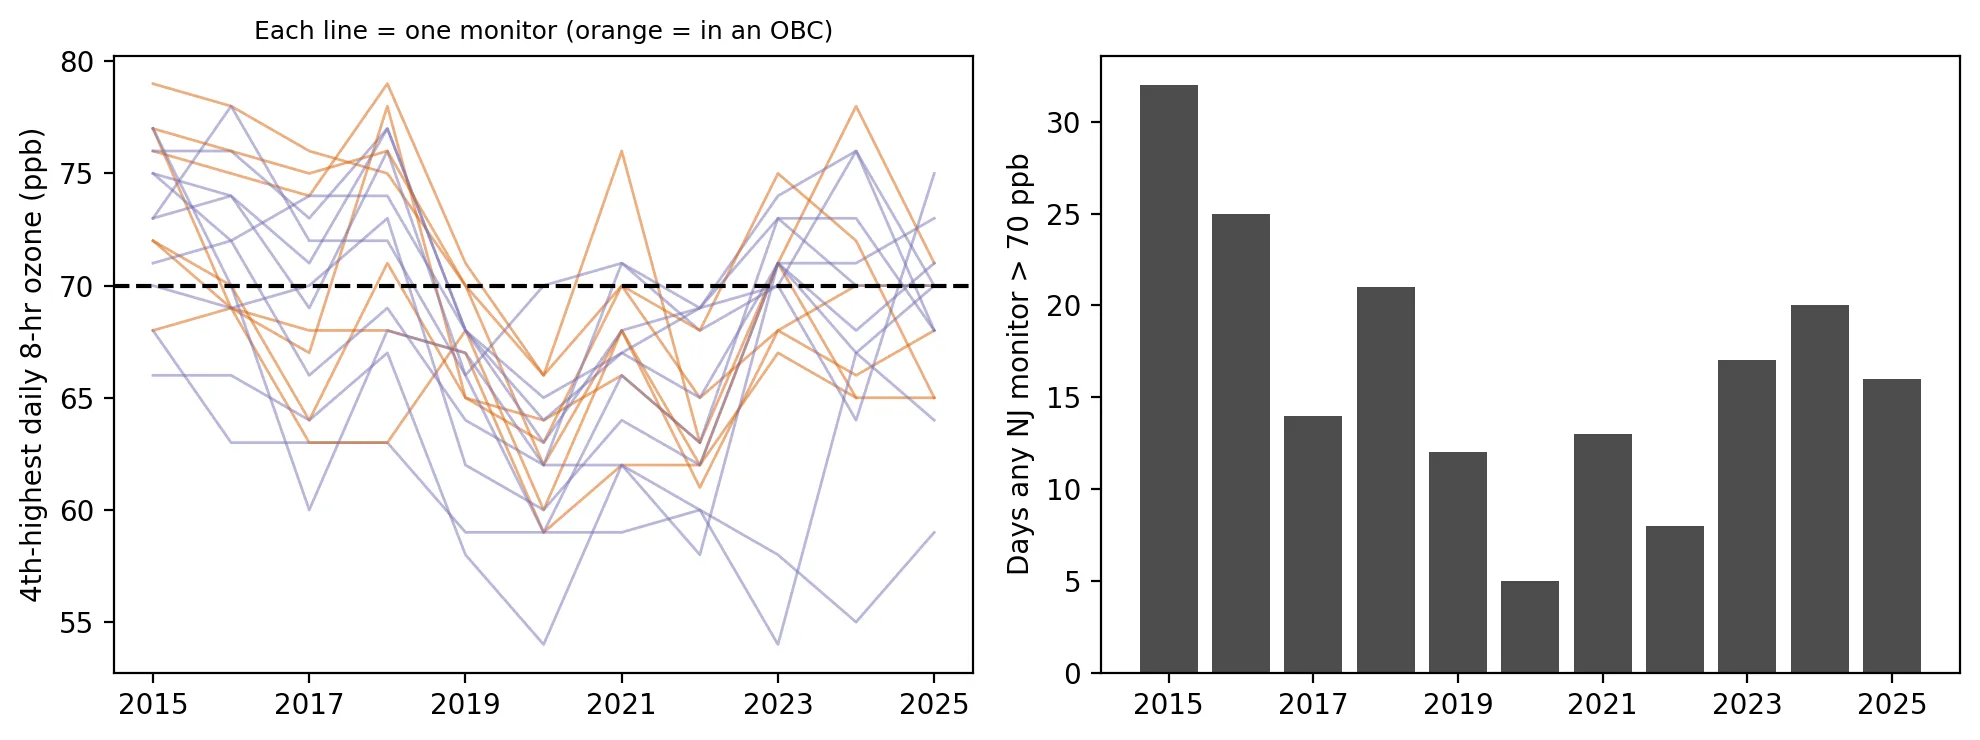 Figure 1. Ozone levels and exceedance days in New Jersey fell to a low in 2020 and have since crept back up.
The best year was 2020, when pandemic lockdowns cut traffic. Since then, ozone has crept back up: exceedance days rose from 5 in 2020 to 17–20 in 2023–2025, and the highest 2023–2025 design value reached 73 ppb, still above the standard. Several monitors, including Leonia, Clarksboro, Rider University, and Washington Crossing, remained at or above 70 ppb. The 2020 dip suggests what deeper cuts in vehicle emissions could achieve. The rebound suggests that without further cuts, New Jersey may not reach the standard.
Similar trends inside and outside overburdened communities
Monitors in OBCs declined slightly faster (an extra −0.28 ppb/yr), but the difference was not statistically significant (p = 0.17). With only 17 monitors, small differences are hard to detect. The result fits what my 2024 ozone post found: ozone is a regional pollutant, so its trends are largely shared across communities.
Why this matters
Ozone is not mainly an environmental justice problem of unequal exposure. It is a shared regional problem. But its health effects are unequal: asthma rates and emergency room visits are higher in many overburdened communities, so the same ozone day can do more harm there. Stalled progress therefore has an equity dimension. The tools that cut ozone, such as cleaner trucks, power plants, and regional limits on upwind emissions, also tend to reduce the local pollution that is concentrated in overburdened communities (see my warehouse boom post and my air toxics post).
Limitations
- Weather drives ozone. Hot summers raise ozone. A full analysis would adjust for temperature, which EPA does in its own trend reports.
- Few monitors, so OBC comparisons have little statistical power.
- Simplified design values. EPA’s official calculations use completeness rules and may exclude exceptional events.
Code project (Level 4→5): trends over time
Goal: Measure ozone trends at New Jersey monitors from 2015 to 2025, and test whether trends differ in OBCs.
Data: EPA AirData daily ozone files, 2015–2025; NJDEP OBC list in effect on the cutoff date.
Method:
- Combine 11 annual files, keep New Jersey’s daily maximum 8-hour values, and compute each monitor’s yearly fourth-highest day.
- For monitors with at least 8 years, compute a linear slope and Kendall’s tau.
- Fit a panel regression with monitor fixed effects, a time trend, and a time × OBC interaction, with errors clustered by monitor.
tau, p = kendalltau(d.year, d.fourth)
m = smf.ols("fourth_ppb ~ t * in_obc + C(site)", data=panel).fit(cov_type="cluster", cov_kwds={"groups": site_ids})
New skills: time-series thinking, nonparametric trend tests, and interaction terms (“does the trend differ by group?”).
Data and methods
Data sources
- EPA AirData daily ozone files, 2015–2025; NJDEP OBC list in effect on the cutoff date.
The analysis was done in Python with public data. The full code, its data, and every figure it produces are in the code project below.
References
- U.S. Environmental Protection Agency. (n.d.-a). Ozone trends. https://www.epa.gov/air-trends/ozone-trends
- U.S. Environmental Protection Agency. (n.d.-b). NAAQS table. https://www.epa.gov/criteria-air-pollutants/naaqs-table
- U.S. Environmental Protection Agency. (n.d.-c). AirData pre-generated data files: Daily ozone (44201), 2015–2025 [Data set]. https://aqs.epa.gov/aqsweb/airdata/download_files.html
- U.S. Environmental Protection Agency. (n.d.-d). Health effects of ozone pollution. https://www.epa.gov/ground-level-ozone-pollution/health-effects-ozone-pollution