Skip to content
SoilStory logo: a seedling growing from layers of soilSoilStory
  • Home
  • Share Your Story
  • Our Story Collection
  • Research
  • Code Projects
  • Our Mission
Español

Research

Research

Each post picks one environmental justice issue in New Jersey and tests it with public data and published science. Every post has a code project that produces its numbers and figures.

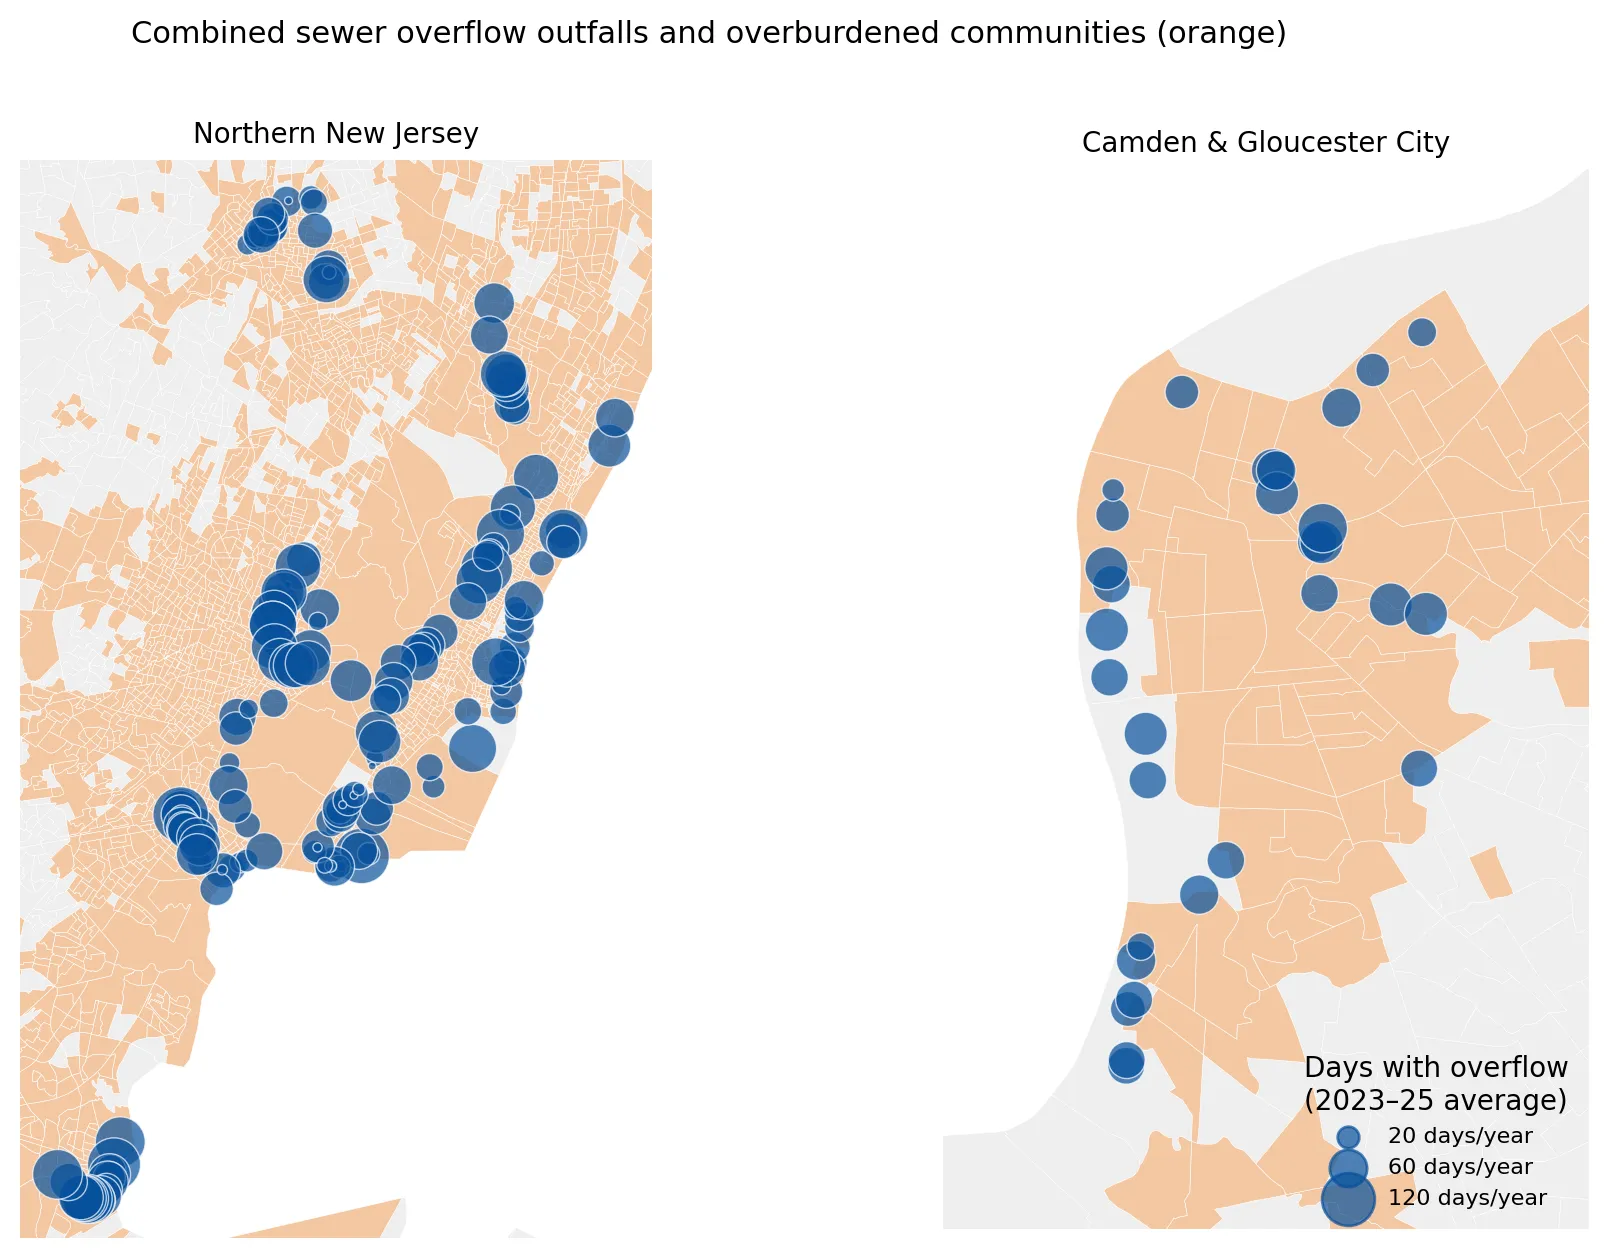
Two maps showing combined sewer overflow outfalls as blue circles sized by average days with overflow per year, over orange overburdened communities, one for northern New Jersey and one for Camden and Gloucester City. Nearly all outfalls lie within overburdened communities, with large clusters along the Passaic and Hackensack waterways and Newark Bay.

When It Rains, It Pours Sewage: Combined Sewer Overflows in New Jersey

Posted on November 7, 2026

When it rains, old combined sewers overflow into New Jersey rivers. I looked at how often outfalls discharge and who lives nearby. (7 min. read)

Continue reading →: When It Rains, It Pours Sewage: Combined Sewer Overflows in New Jersey
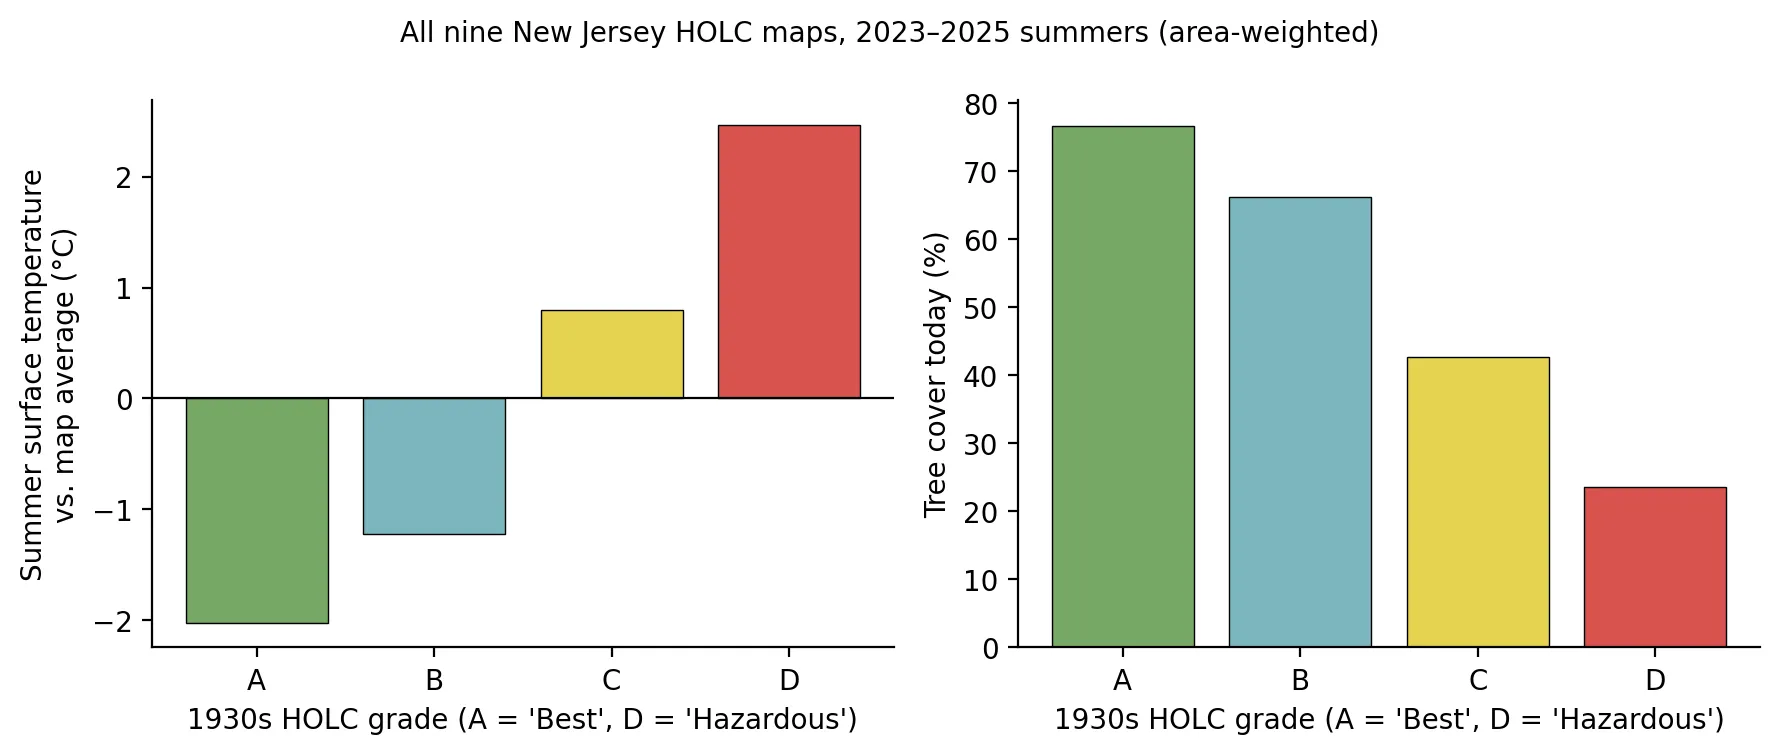
Two bar charts by 1930s HOLC grade A to D. Summer surface temperature relative to the map average rises from about 2 degrees Celsius below average in grade A to about 2.5 above in grade D, while present-day tree cover falls from about 77% in A to about 24% in D.

Mapped in 1937, Hotter in 2026: Redlining, Trees, and Heat in New Jersey

Posted on November 7, 2026

Neighborhoods redlined in the 1930s are hotter today, and tree cover explains most of the gap. Satellite heat and redlining in New Jersey. (11 min. read)

Continue reading →: Mapped in 1937, Hotter in 2026: Redlining, Trees, and Heat in New Jersey
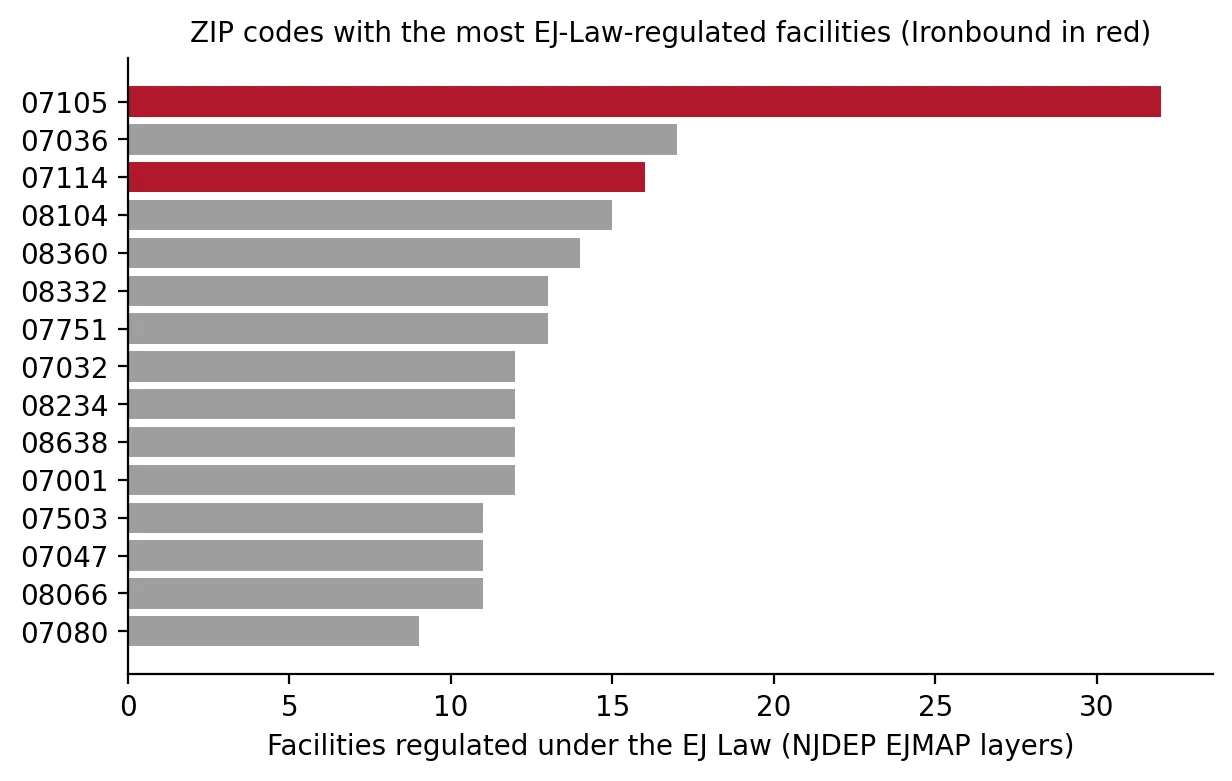
Horizontal bar chart of the ZIP codes with the most EJ Law regulated facilities, with the two Ironbound ZIP codes in red. ZIP 07105 leads with 32, nearly twice the next ZIP (07036 with 17), and 07114 ranks third with 16.

A Power Plant for Every Square Mile? The Ironbound and the Hardest Case for Environmental Justice Law

Posted on November 7, 2026

Does the Ironbound really host more environmental-justice-regulated facilities than anywhere in New Jersey? I tested the claim in the PVSC plant case. (9 min. read)

Continue reading →: A Power Plant for Every Square Mile? The Ironbound and the Hardest Case for Environmental Justice Law
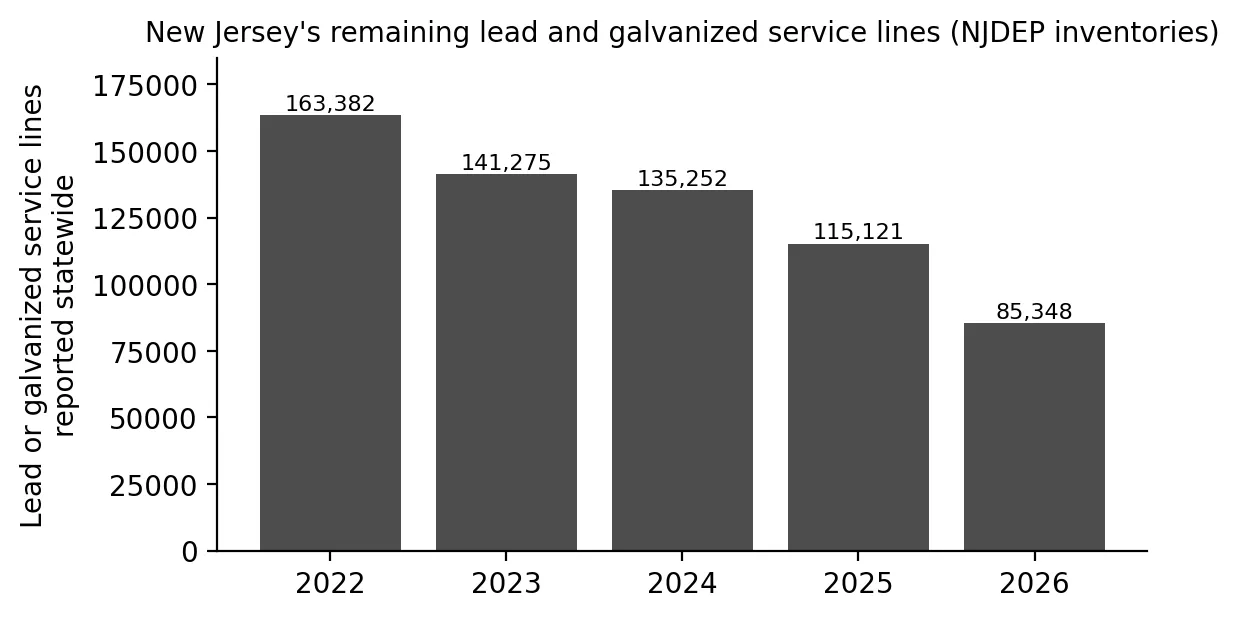
Bar chart of lead and galvanized service lines reported statewide in New Jersey, falling each year from 163,382 in 2022 to 141,275, 135,252, 115,121, and 85,348 in 2026.

Getting the Lead Out: Pipes, Paint, and Children's Blood in New Jersey

Posted on November 7, 2026

Lead pipes, old paint, and children's blood lead in New Jersey: where elevated levels are concentrated and what Newark and Trenton show about progress. (8 min. read)

Continue reading →: Getting the Lead Out: Pipes, Paint, and Children's Blood in New Jersey
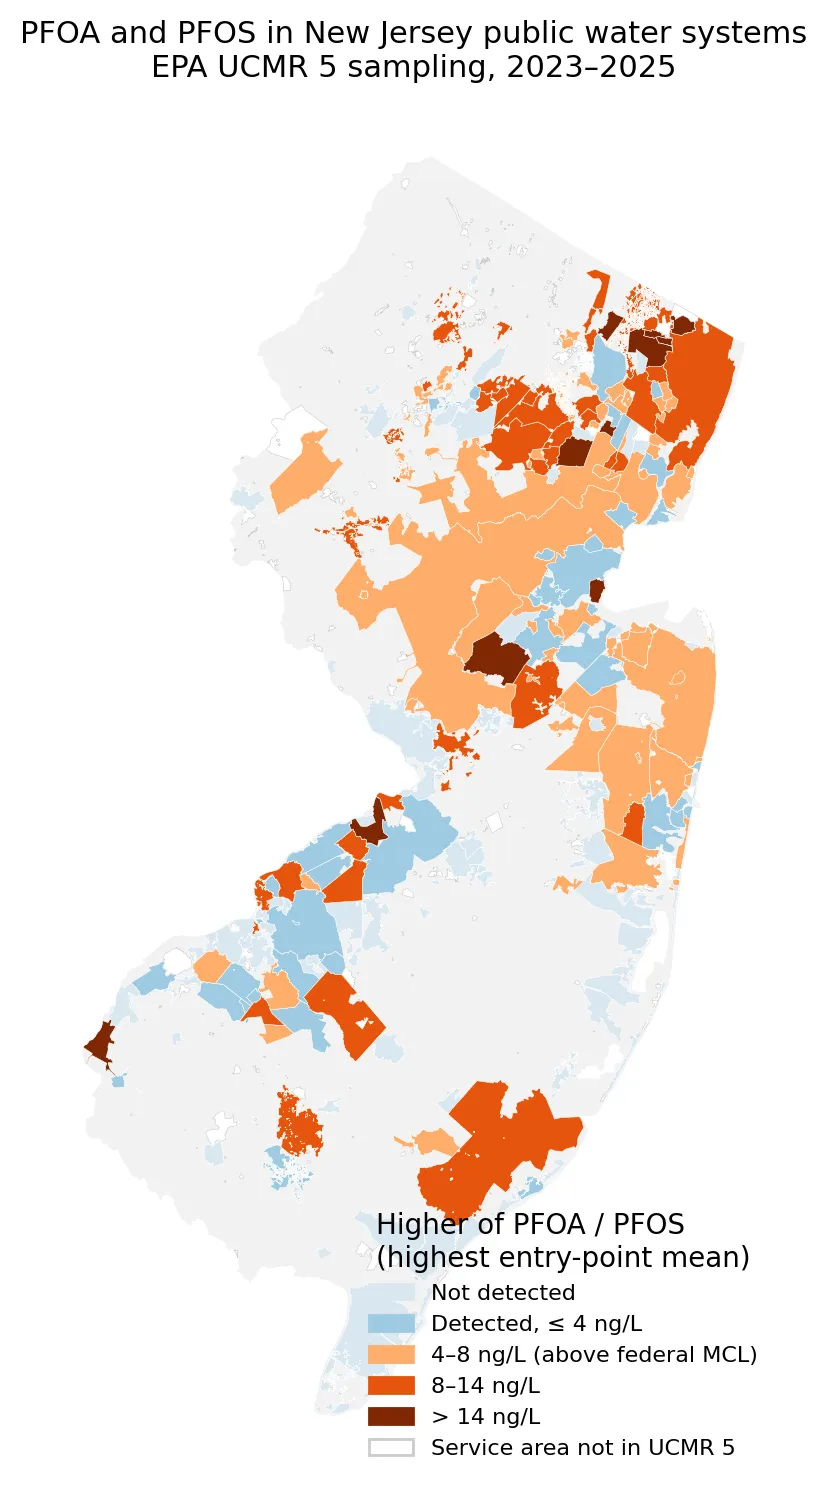
Map of New Jersey water system service areas colored by the higher of PFOA or PFOS level in EPA UCMR 5 sampling, from not detected to above 14 ng/L. The highest levels, shown in dark brown, appear mainly in northeastern Bergen and Essex counties and a few scattered systems, with many central and coastal areas at 4 to 14 ng/L.

Forever Chemicals, Everyone's Problem? PFAS in New Jersey's Drinking Water

Posted on November 7, 2026

PFAS in New Jersey drinking water are widely shared across the state. A look at federal testing results, who is affected, and who pays for treatment. (8 min. read)

Continue reading →: Forever Chemicals, Everyone's Problem? PFAS in New Jersey's Drinking Water
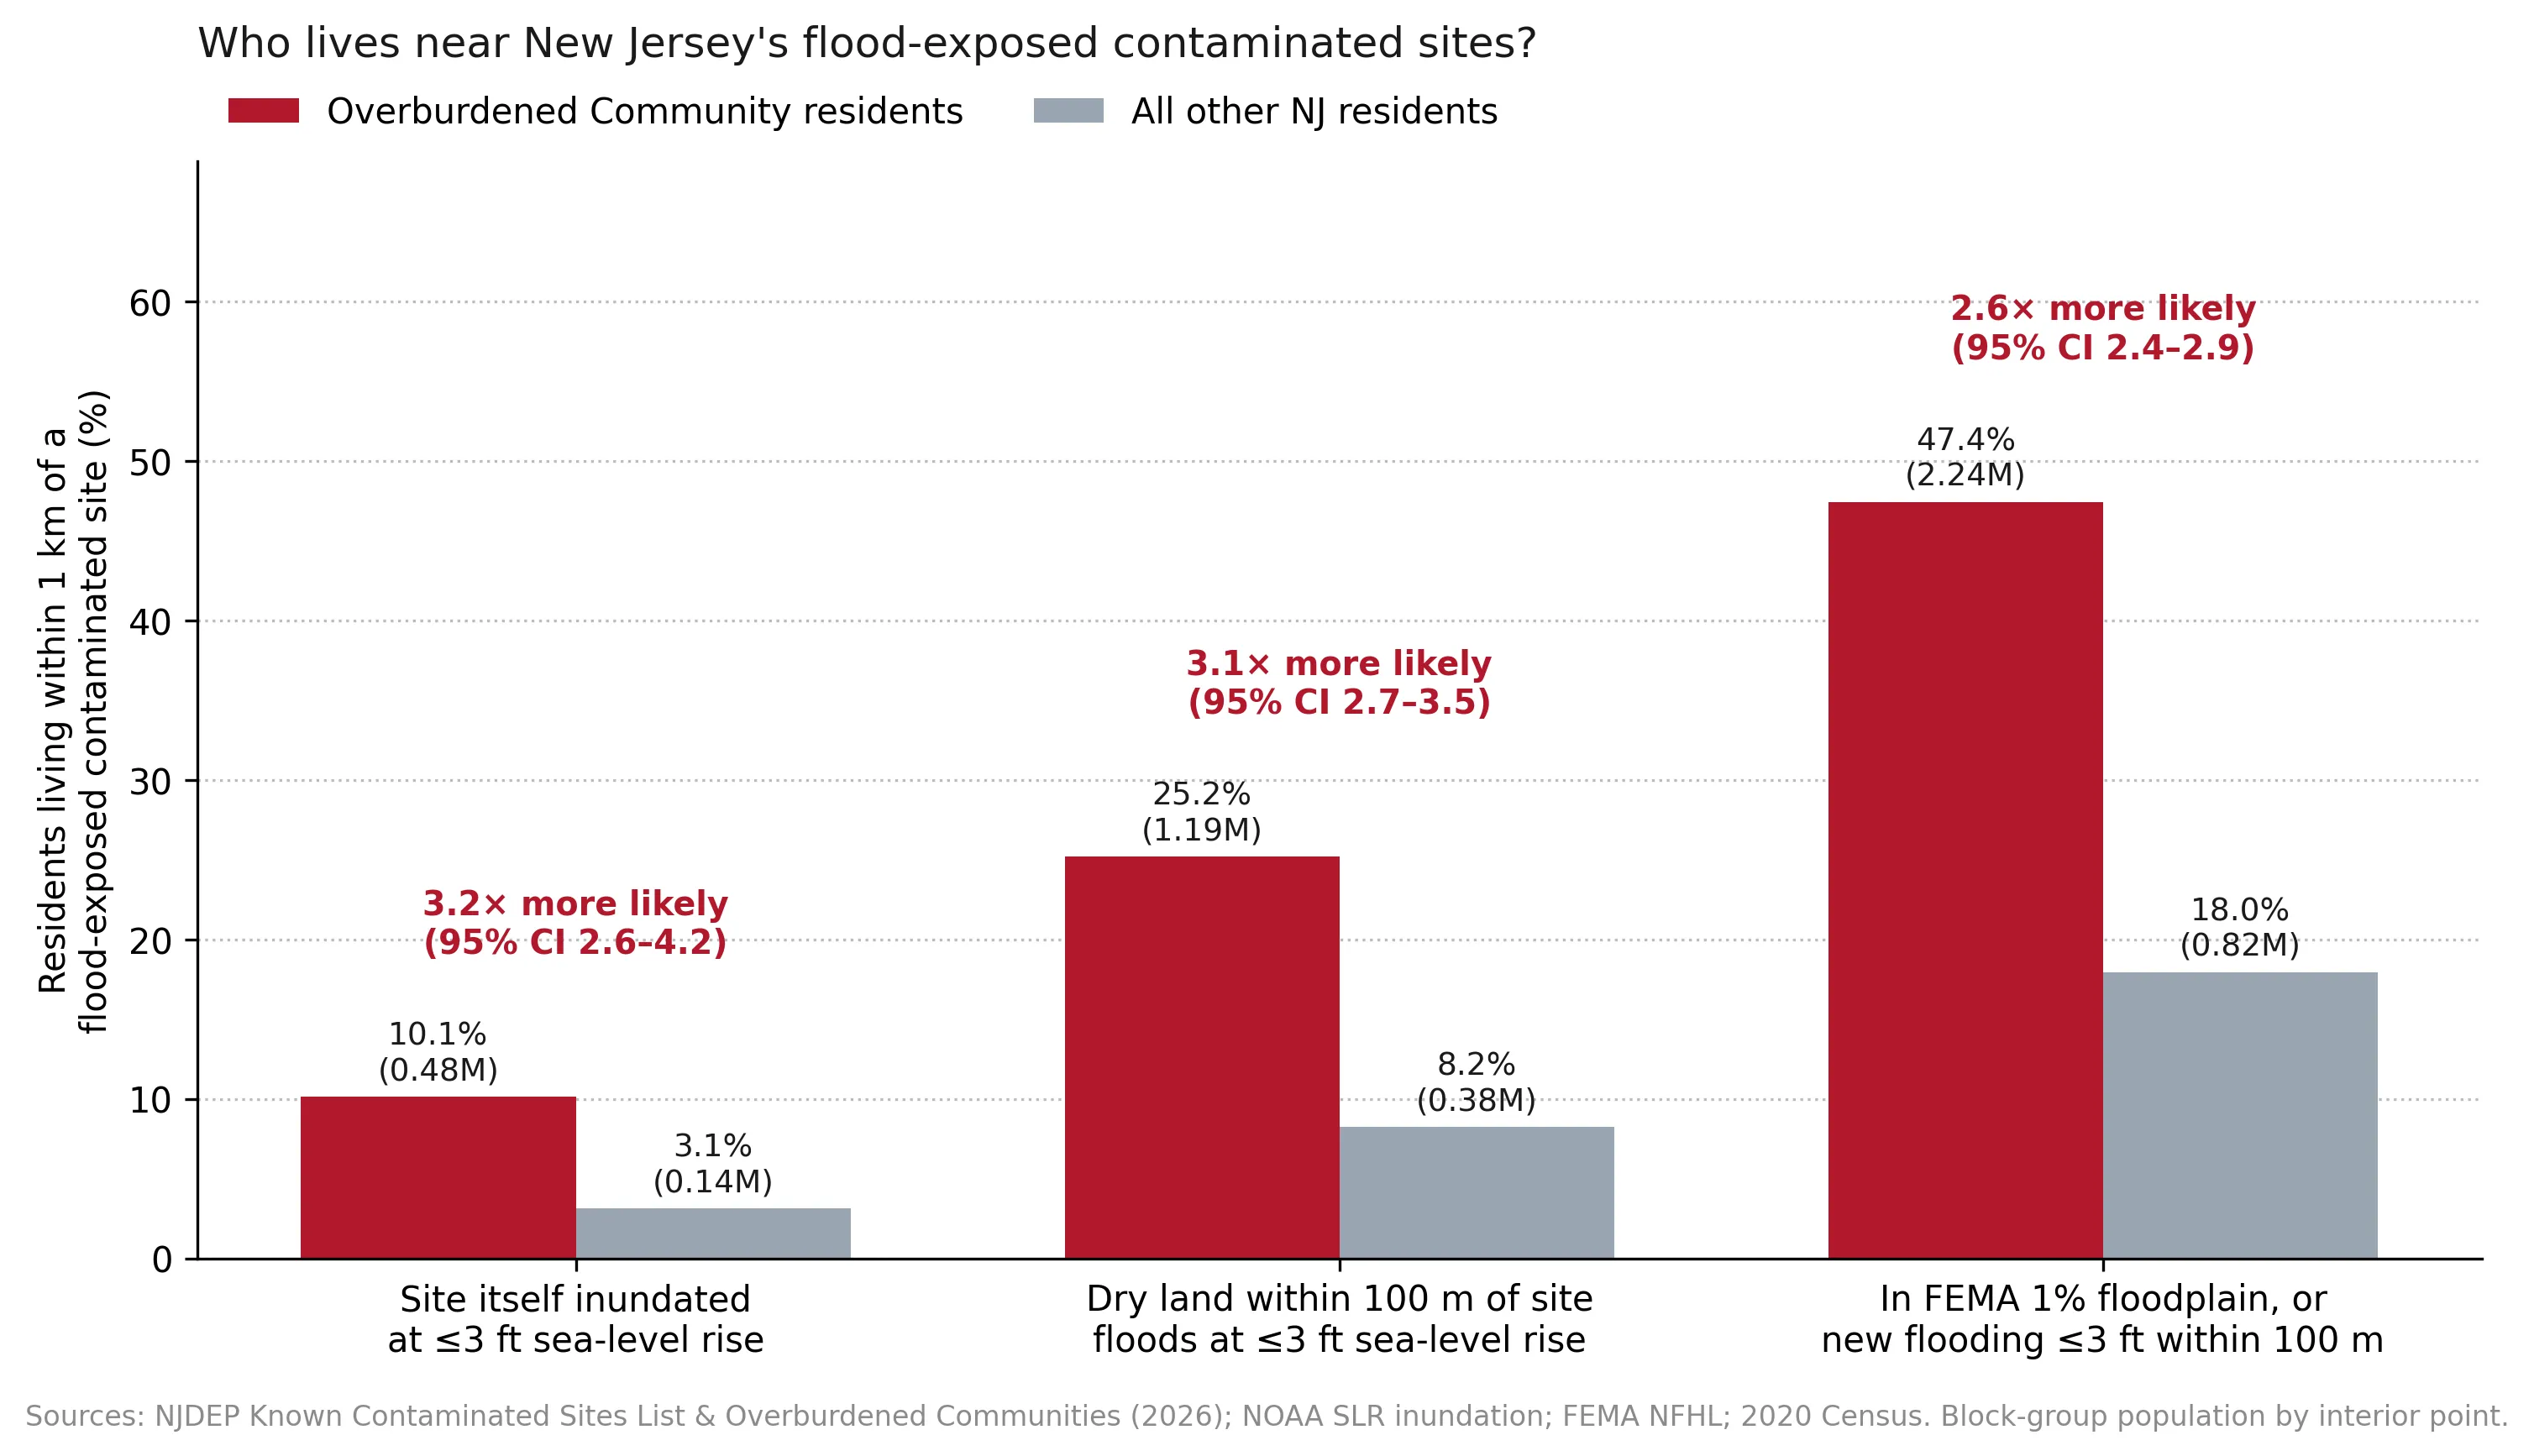
Grouped bar chart of the share of residents within 1 km of a flood-exposed contaminated site under three definitions, for overburdened and other residents. Overburdened residents are about 2.6 to 3.2 times more likely, for example 25.2% versus 8.2% for dry land flooding at 3 feet or less of sea-level rise.

Toxic Tides: When Rising Seas Meet New Jersey's Contaminated Sites

Posted on November 7, 2026

What happens when rising seas reach New Jersey's contaminated sites? I looked at which sites could flood and which communities live closest to them. (7 min. read)

Continue reading →: Toxic Tides: When Rising Seas Meet New Jersey's Contaminated Sites
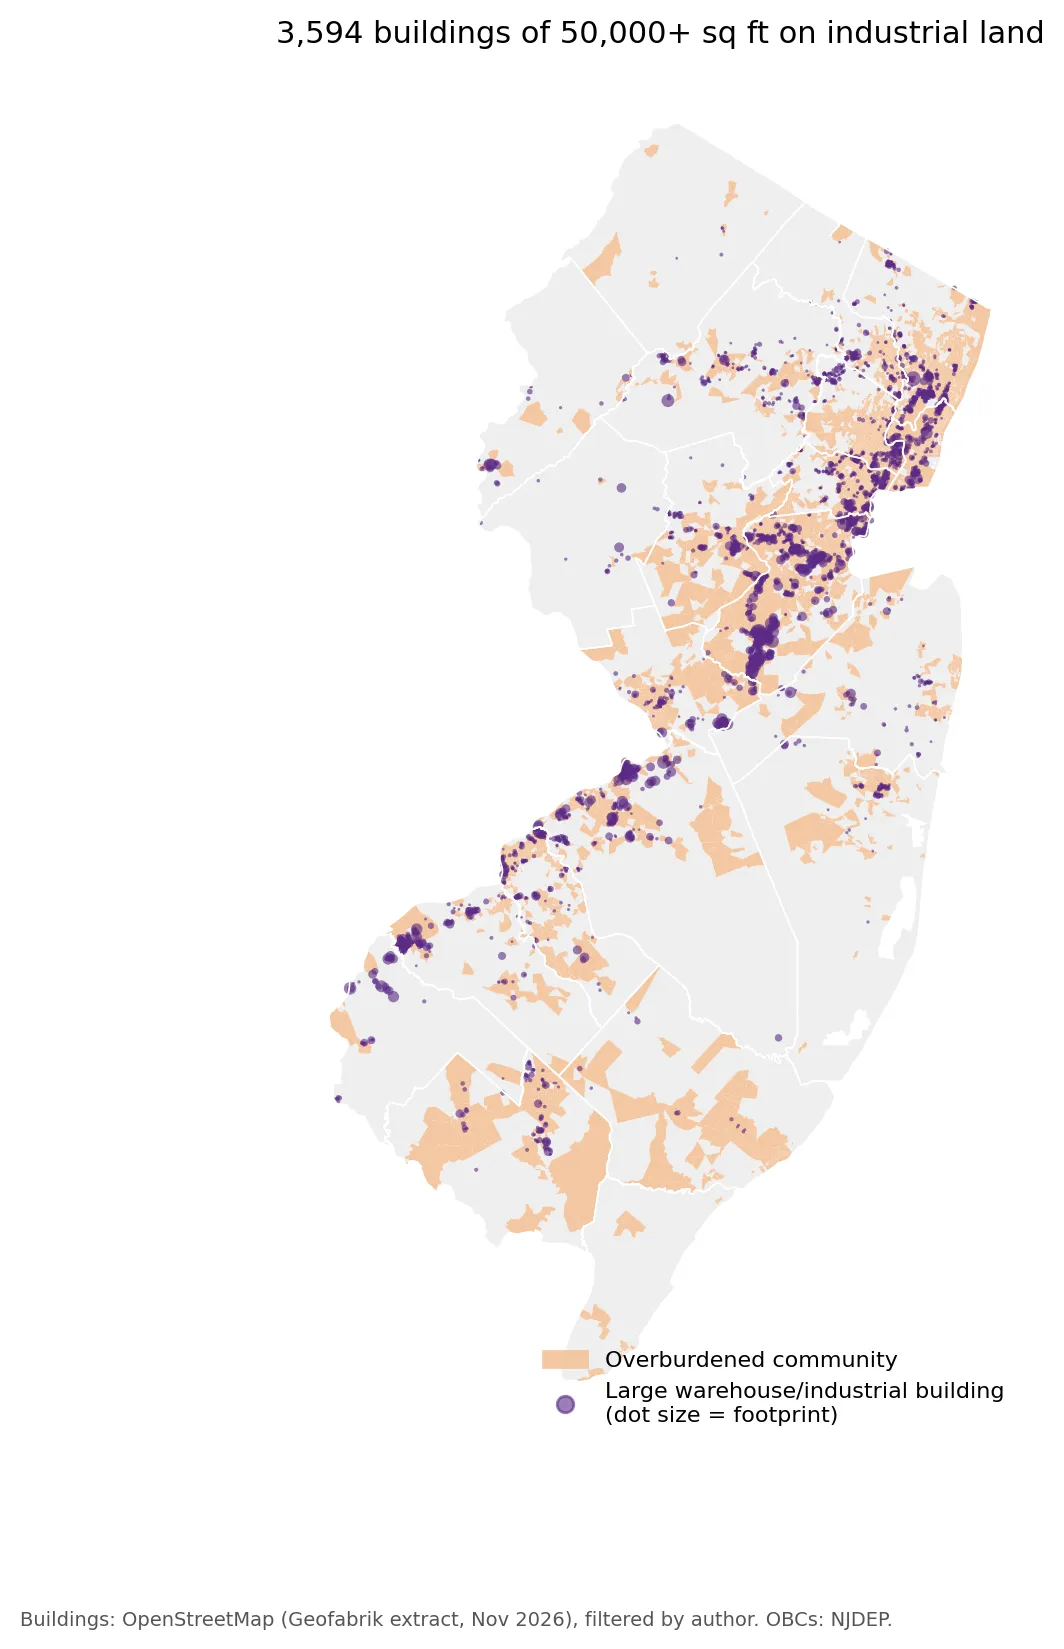
Map of New Jersey with 3,594 large warehouse and industrial buildings of 50,000 square feet or more shown as purple dots sized by footprint over orange overburdened communities. Dense clusters run along the northeastern corridor, in central Middlesex County, and along the Delaware River in Burlington and Gloucester counties.

The Warehouse State: Diesel, Distribution, and a Gap in New Jersey's Environmental Justice Law

Posted on November 7, 2026

Diesel, distribution, and a gap in New Jersey's Environmental Justice Law: who lives near large warehouses, and what a proposed warehouse bill would cover. (9 min. read)

Continue reading →: The Warehouse State: Diesel, Distribution, and a Gap in New Jersey's Environmental Justice Law
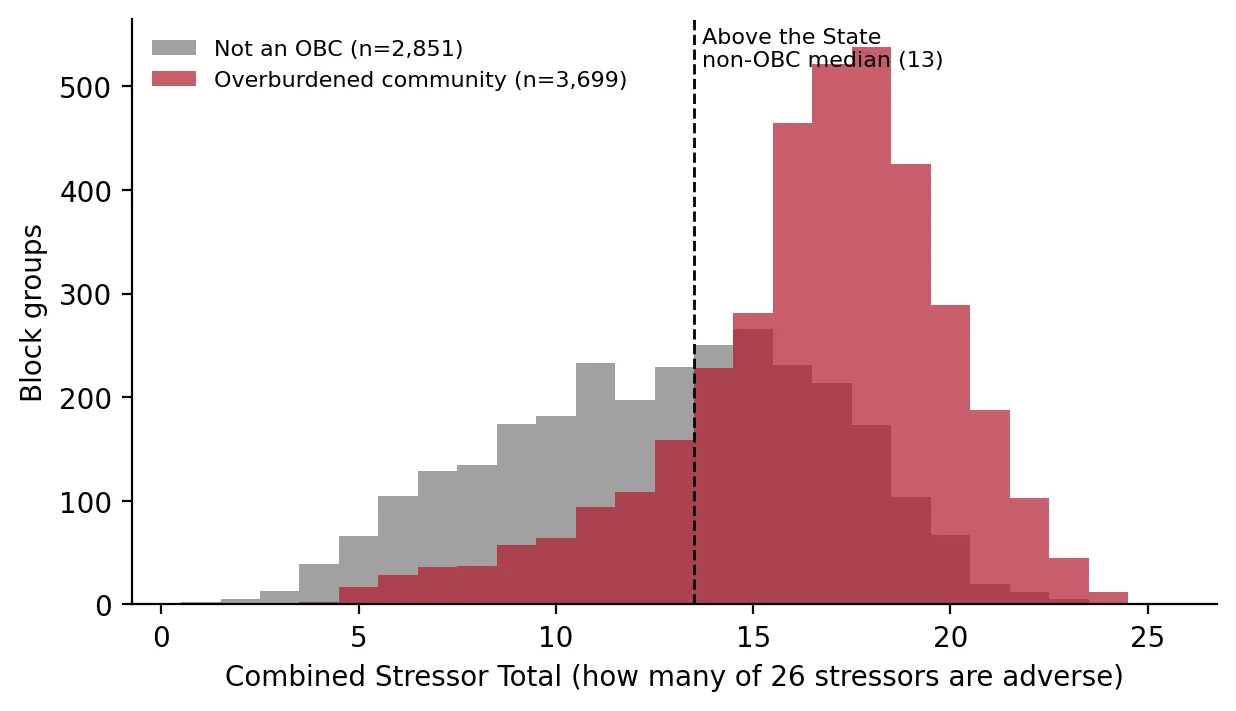
Overlapping histograms of Combined Stressor Totals for 2,851 non-overburdened and 3,699 overburdened block groups. Overburdened communities peak around 17 of 26 stressors, well above the state non-OBC median of 13, while other block groups are spread lower, mostly between 5 and 14.

Denial by Default? New Jersey's Environmental Justice Law Goes to the State Supreme Court

Posted on November 6, 2026

How New Jersey's Environmental Justice Law works, what the courts have decided, and what the data show as the state Supreme Court reviews the rules. (16 min. read)

Continue reading →: Denial by Default? New Jersey's Environmental Justice Law Goes to the State Supreme Court
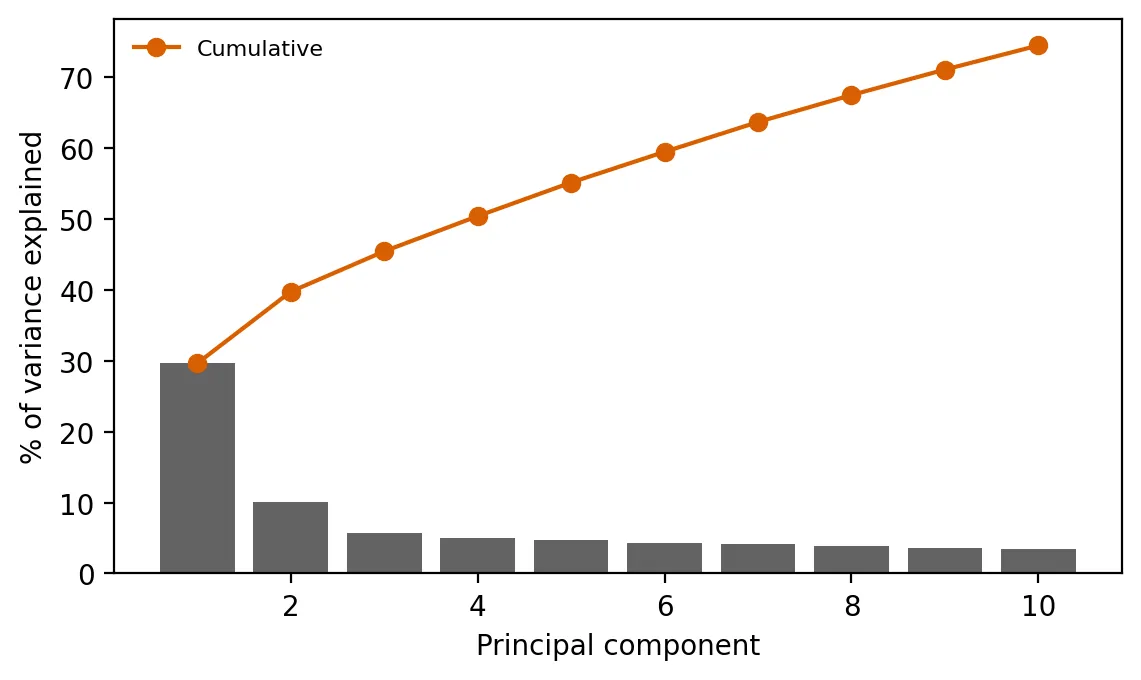
Scree plot of the percent of variance explained by each of the first 10 principal components, with a cumulative line. The first component explains about 30% and the second about 10%, with the rest each under 6% and the cumulative total reaching about 75%.

Capstone: Building a Cumulative-Burden Index from the Data Up

Posted on October 26, 2026

This capstone builds a cumulative-burden index from 26 measures, compares it with NJDEP's official count, and sorts burdened places into three types. (6 min. read)

Continue reading →: Capstone: Building a Cumulative-Burden Index from the Data Up
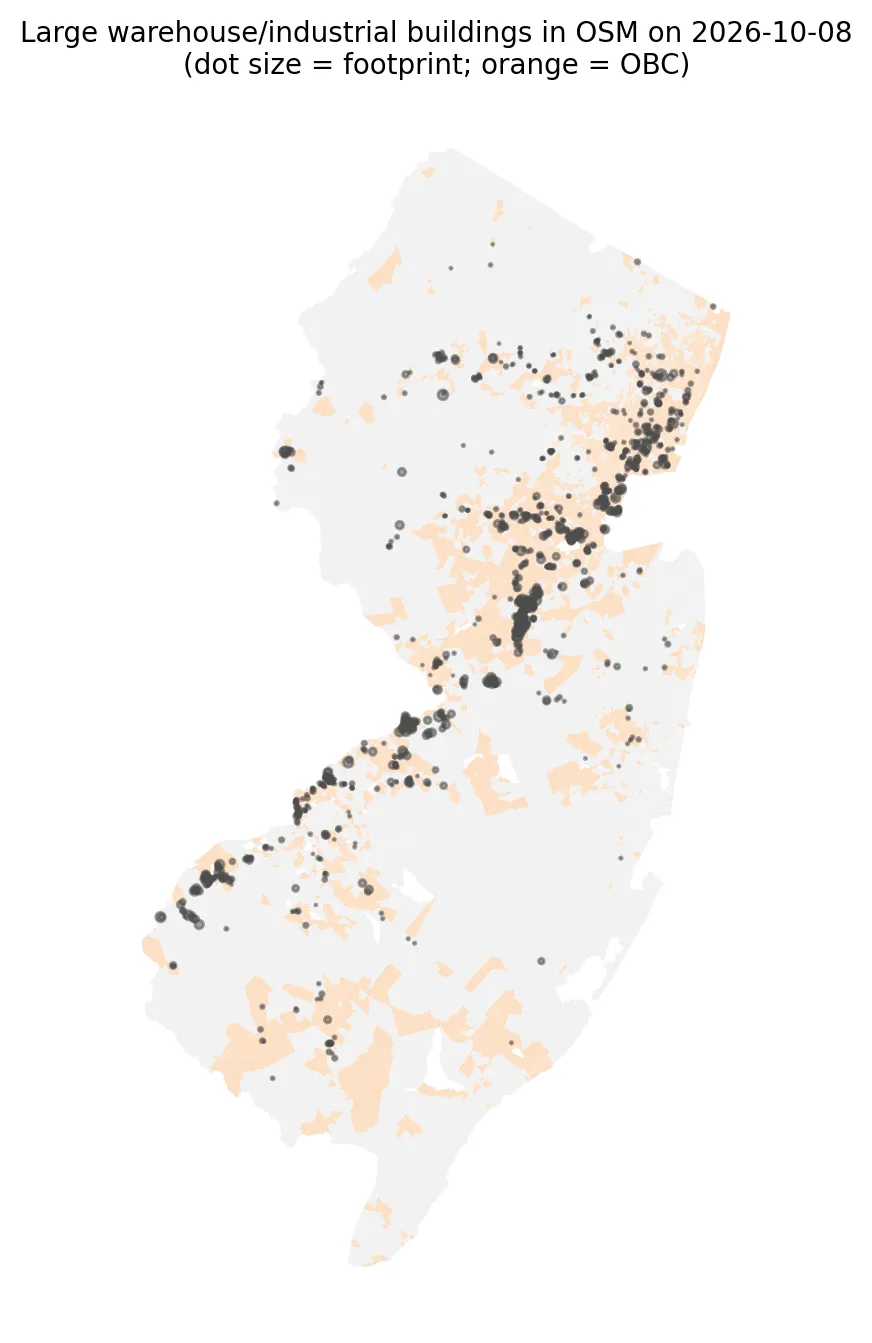
Map of New Jersey showing large warehouse and industrial buildings from OpenStreetMap as dots sized by footprint, over orange overburdened communities. Buildings cluster along the northeastern corridor, in central Middlesex County, and along the Delaware River in the southwest.

Can Open Data Map New Jersey's Warehouses? A Lesson in Data Gaps and Spatial Bias

Posted on October 8, 2026

Can free OpenStreetMap data map New Jersey's warehouses? I checked how complete it is and who lives near the mapped buildings, using spatial statistics. (4 min. read)

Continue reading →: Can Open Data Map New Jersey's Warehouses? A Lesson in Data Gaps and Spatial Bias
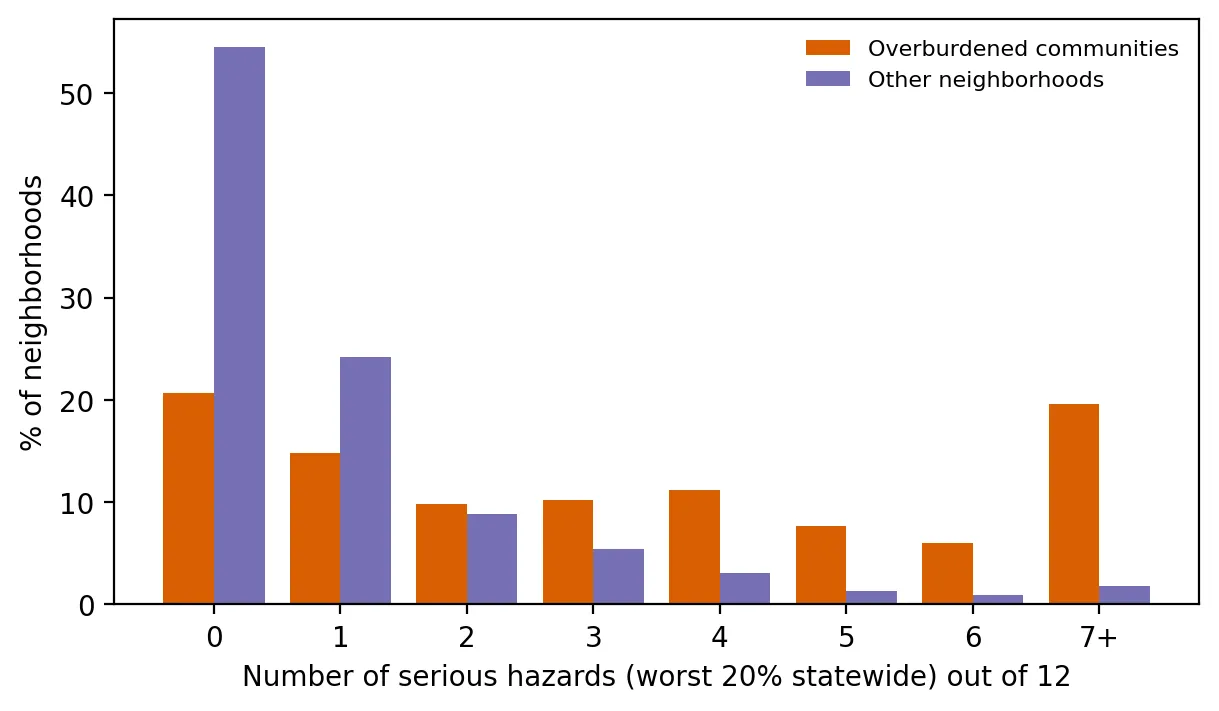
Grouped bar chart of the percent of neighborhoods by number of serious hazards out of 12, comparing overburdened communities with other neighborhoods. About 55% of other neighborhoods have none, while overburdened communities are spread out, with about 20% having seven or more.

Piling Up: How Many Serious Hazards Does Each Neighborhood Face at Once?

Posted on September 24, 2026

How many serious environmental hazards does each New Jersey neighborhood face at once? Overburdened communities face far more, even within the same county. (4 min. read)

Continue reading →: Piling Up: How Many Serious Hazards Does Each Neighborhood Face at Once?
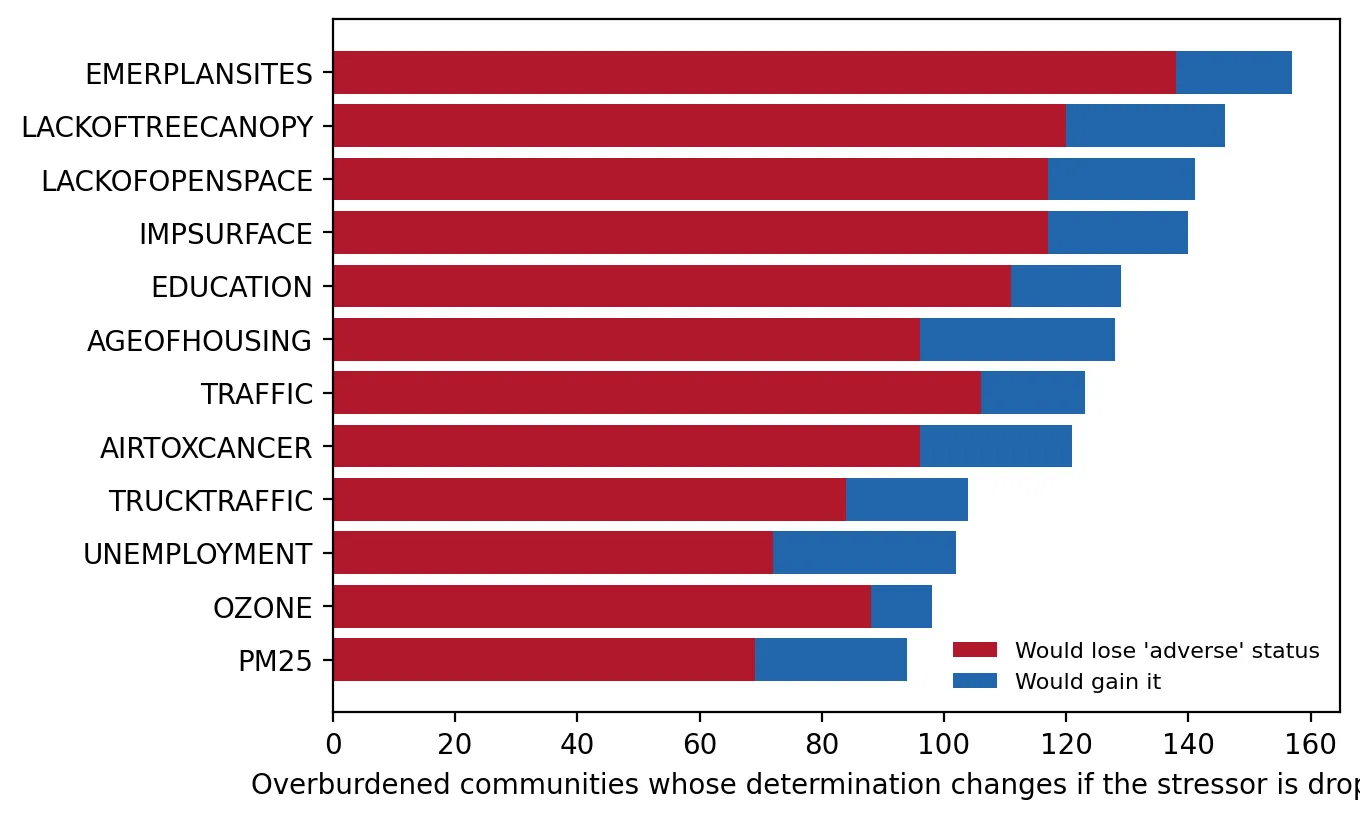
Horizontal stacked bar chart showing, for each of 12 stressors, how many overburdened communities would lose or gain adverse status if that stressor were dropped. Totals range from about 94 for PM2.5 to 157 for emergency planning sites, with most changes being losses.

The Supreme Court Takes the Case: Stress-Testing New Jersey's Stressor Test

Posted on September 10, 2026

Stress-testing NJDEP's cumulative stressor test as the NJ Supreme Court takes the case: what if one stressor is dropped or the data have small errors? (5 min. read)

Continue reading →: The Supreme Court Takes the Case: Stress-Testing New Jersey's Stressor Test
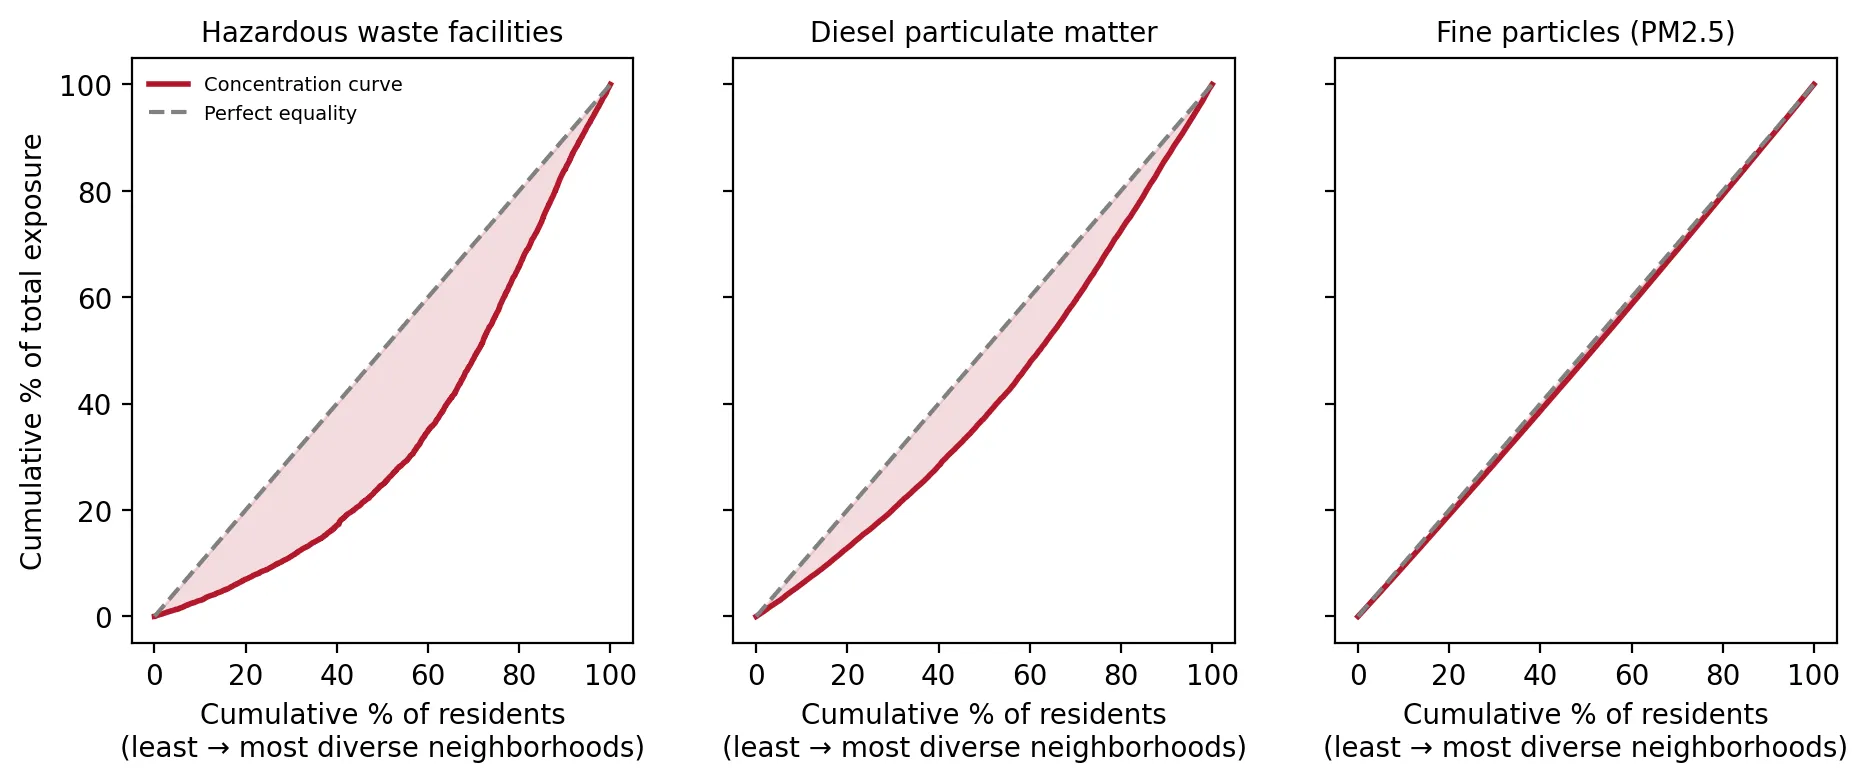
Three side-by-side concentration curve charts for hazardous waste facilities, diesel particulate matter, and fine particles (PM2.5), plotting cumulative share of exposure against residents ordered from least to most diverse neighborhoods. The hazardous waste curve sags far below the line of equality, diesel sags less, and PM2.5 sits almost on the line.

How Unequal Is It? Measuring New Jersey's Pollution Gap Like Economists Measure Income Inequality

Posted on August 28, 2026

Measuring New Jersey's pollution gap like income inequality: which environmental burdens are most unequal, and whether race or income matters more. (4 min. read)

Continue reading →: How Unequal Is It? Measuring New Jersey's Pollution Gap Like Economists Measure Income Inequality
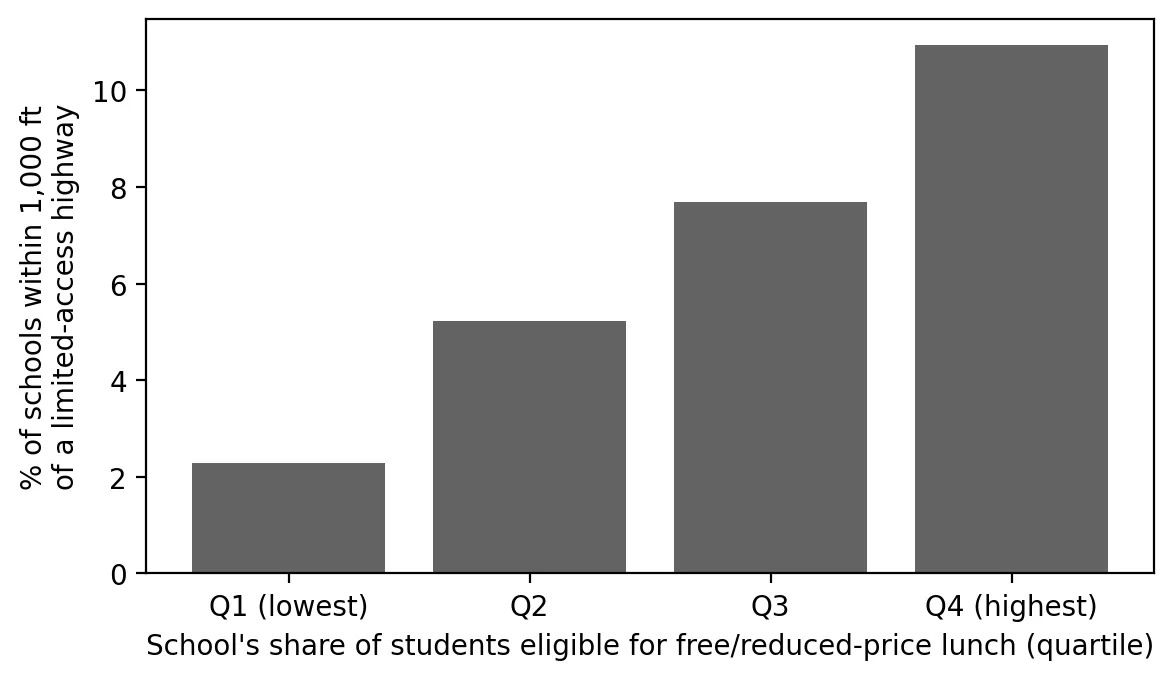
Bar chart of the percent of New Jersey schools within 1,000 feet of a limited-access highway, by quartile of students eligible for free or reduced-price lunch. The share rises from 2.3% in the lowest quartile to 5.2%, 7.7%, and 10.9% in the highest.

Back to School Next to the Highway

Posted on August 18, 2026

How many New Jersey students go to school next to a major highway, and are they more likely to be low-income? A look at schools and highways. (4 min. read)

Continue reading →: Back to School Next to the Highway
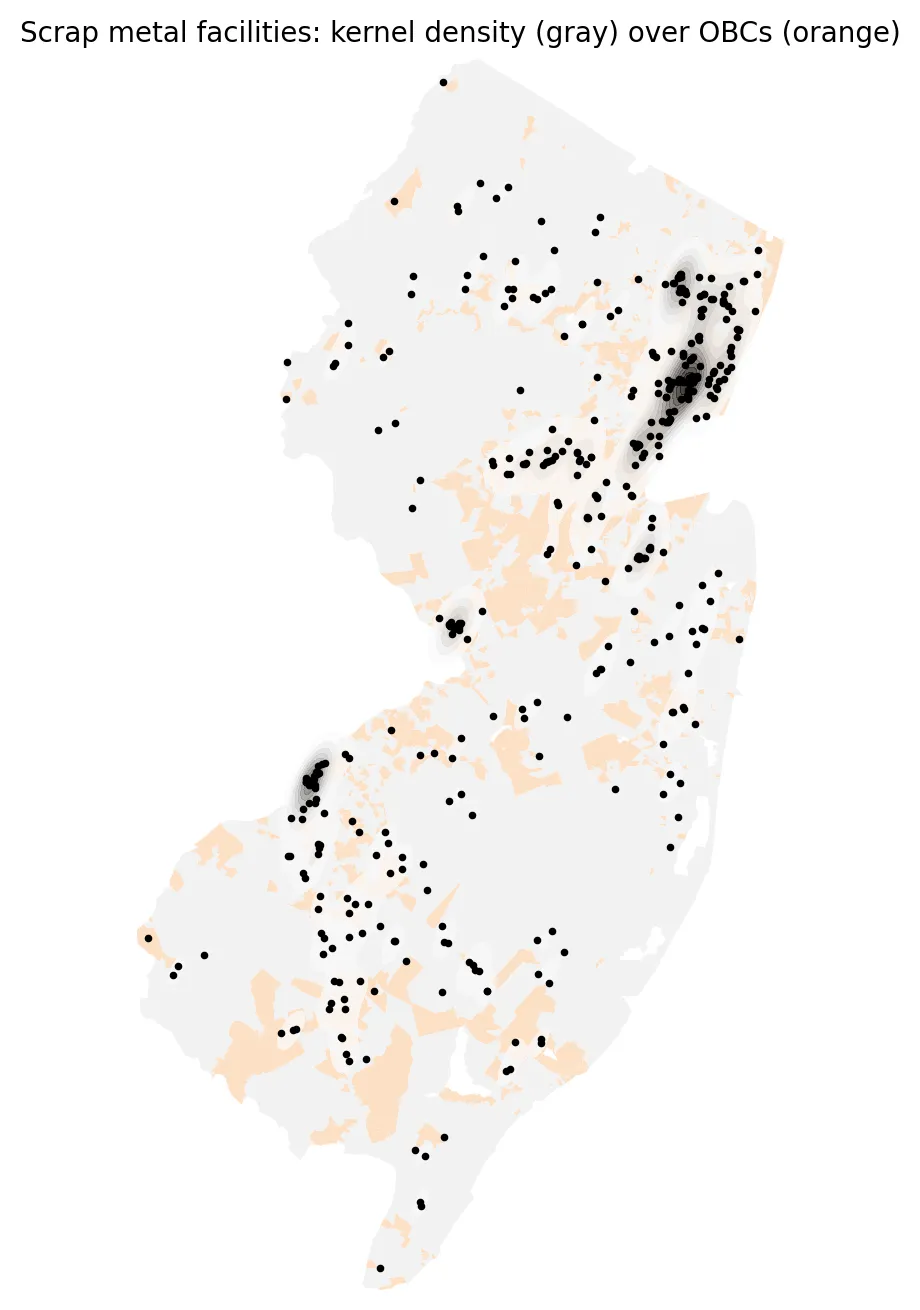
Map of New Jersey showing scrap metal facilities as black dots over a gray kernel density surface and orange overburdened communities. The densest clusters are in the northeastern Newark-Elizabeth-Jersey City corridor, with smaller hot spots near Trenton and along the Camden waterfront.

The Scrap Yard Next Door: Mapping New Jersey's Metal Recyclers

Posted on August 6, 2026

Where are New Jersey's scrap metal yards, and who lives near them? A map and distance analysis of metal recyclers and overburdened communities. (3 min. read)

Continue reading →: The Scrap Yard Next Door: Mapping New Jersey's Metal Recyclers
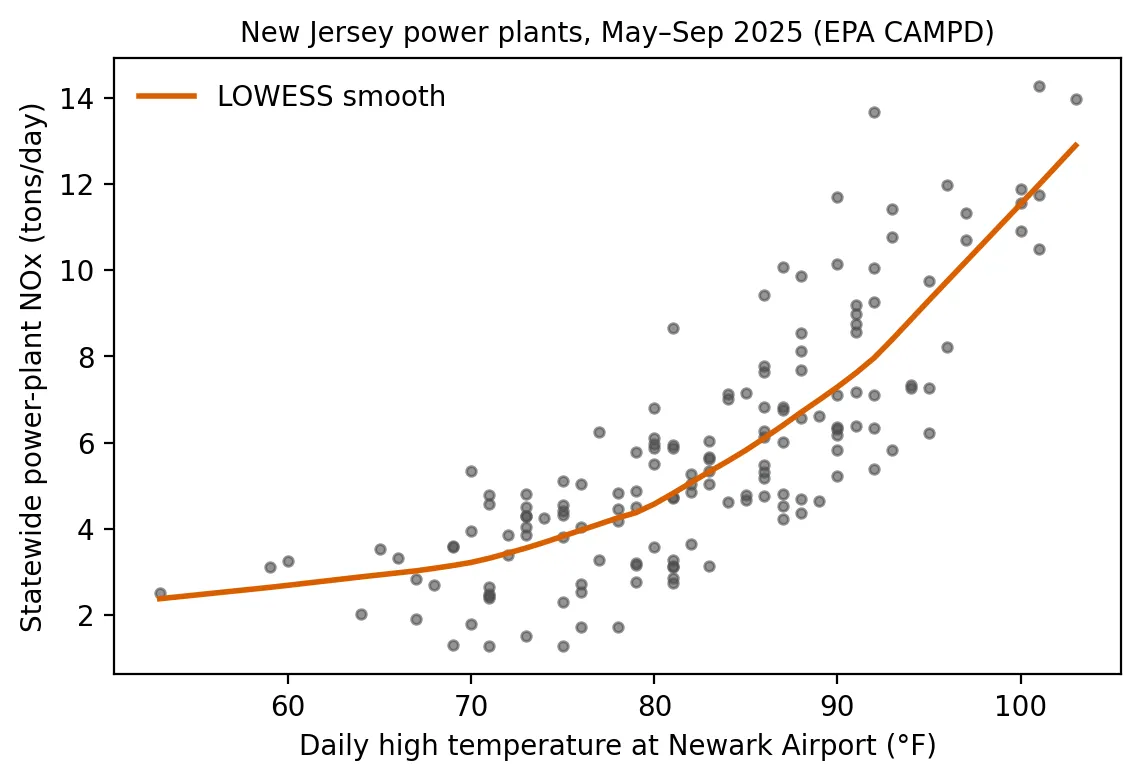
Scatter plot of daily statewide power-plant NOx in tons against Newark's daily high temperature, May to September 2025, with a smoothed curve that stays fairly flat through the 60s and 70s, then climbs steeply above about 90°F to roughly 13 tons per day near 103°F.

Peaker Plants on Hot Days: When the Heat Rises, So Does Power-Plant Pollution

Posted on July 30, 2026

On New Jersey's hottest days, power-plant pollution rises and older peaker plants switch on. A look at 2025 emissions, temperatures and who lives nearby. (4 min. read)

Continue reading →: Peaker Plants on Hot Days: When the Heat Rises, So Does Power-Plant Pollution
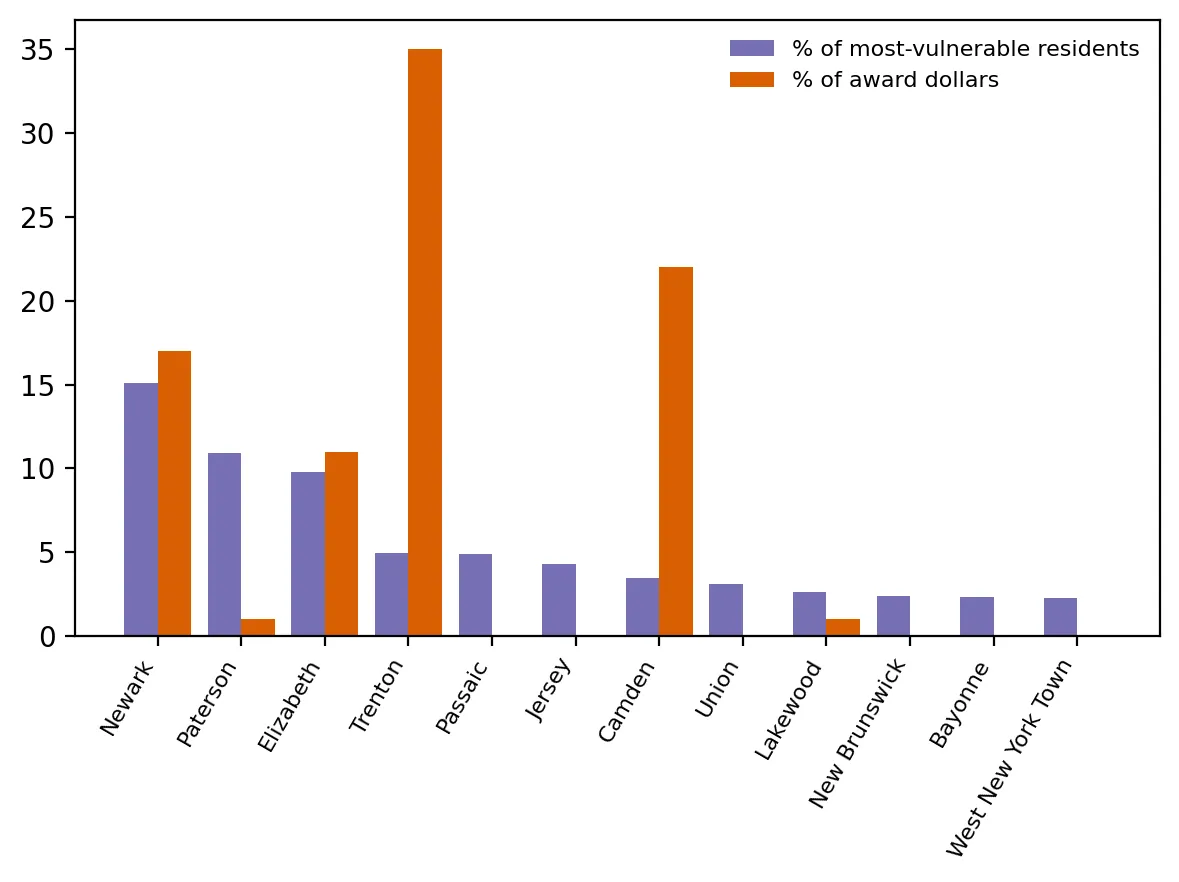
Paired bar chart for 12 municipalities comparing each one's percent of most-vulnerable residents with its percent of award dollars. Trenton gets about 35% of dollars with about 5% of residents and Camden about 22% with about 3%, while Paterson gets 1% with about 11% and several others, including Passaic and Jersey City, get none.

Did the Heat Grants Reach the Hottest Places?

Posted on July 21, 2026

Did New Jersey's heat-island grants reach the hottest, most vulnerable places? A comparison of awards with heat vulnerability and hot spots. (4 min. read)

Continue reading →: Did the Heat Grants Reach the Hottest Places?
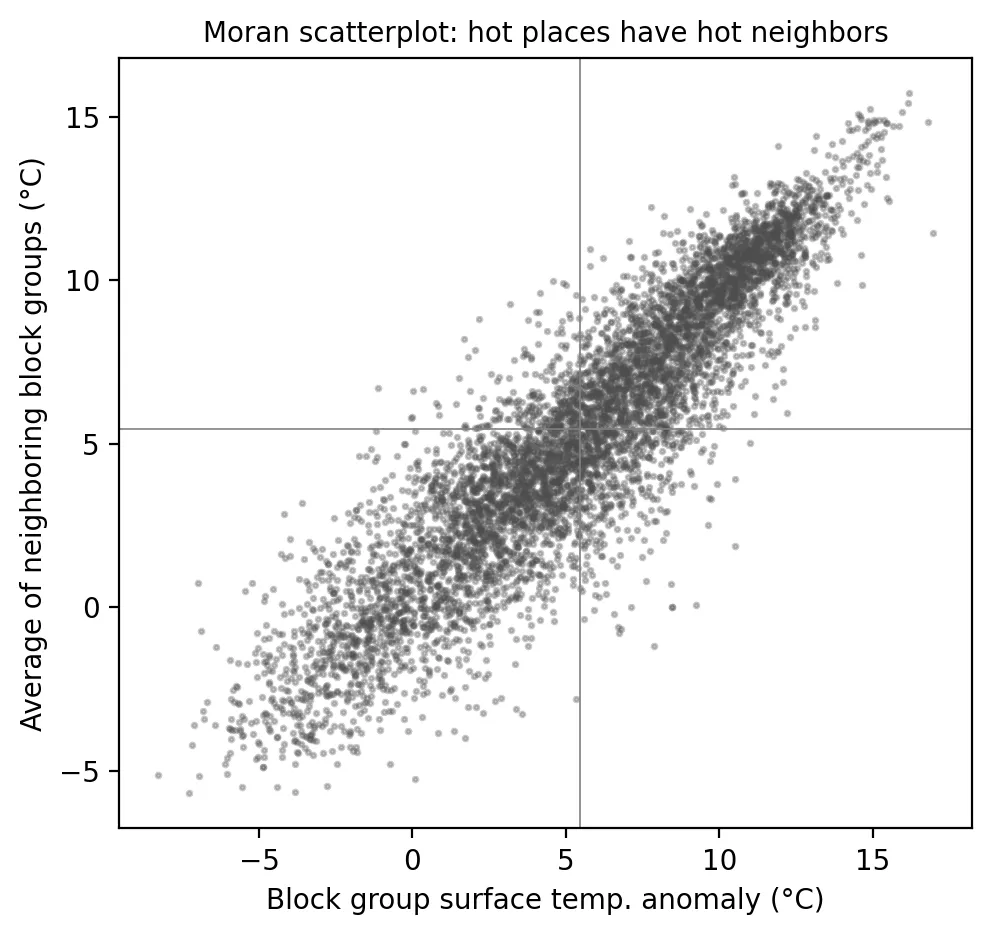
Scatter plot of each block group's surface temperature anomaly against the average of its neighbors, both in degrees Celsius. The points form a tight upward line from about -8 to 17, showing that hot block groups have hot neighbors (global Moran's I of 0.84).

The July Heat Wave: Mapping New Jersey's Heat Hot Spots

Posted on July 9, 2026

After a deadly July heat wave, a look at how New Jersey's hottest neighborhoods form large connected clusters and who lives in them. (4 min. read)

Continue reading →: The July Heat Wave: Mapping New Jersey's Heat Hot Spots
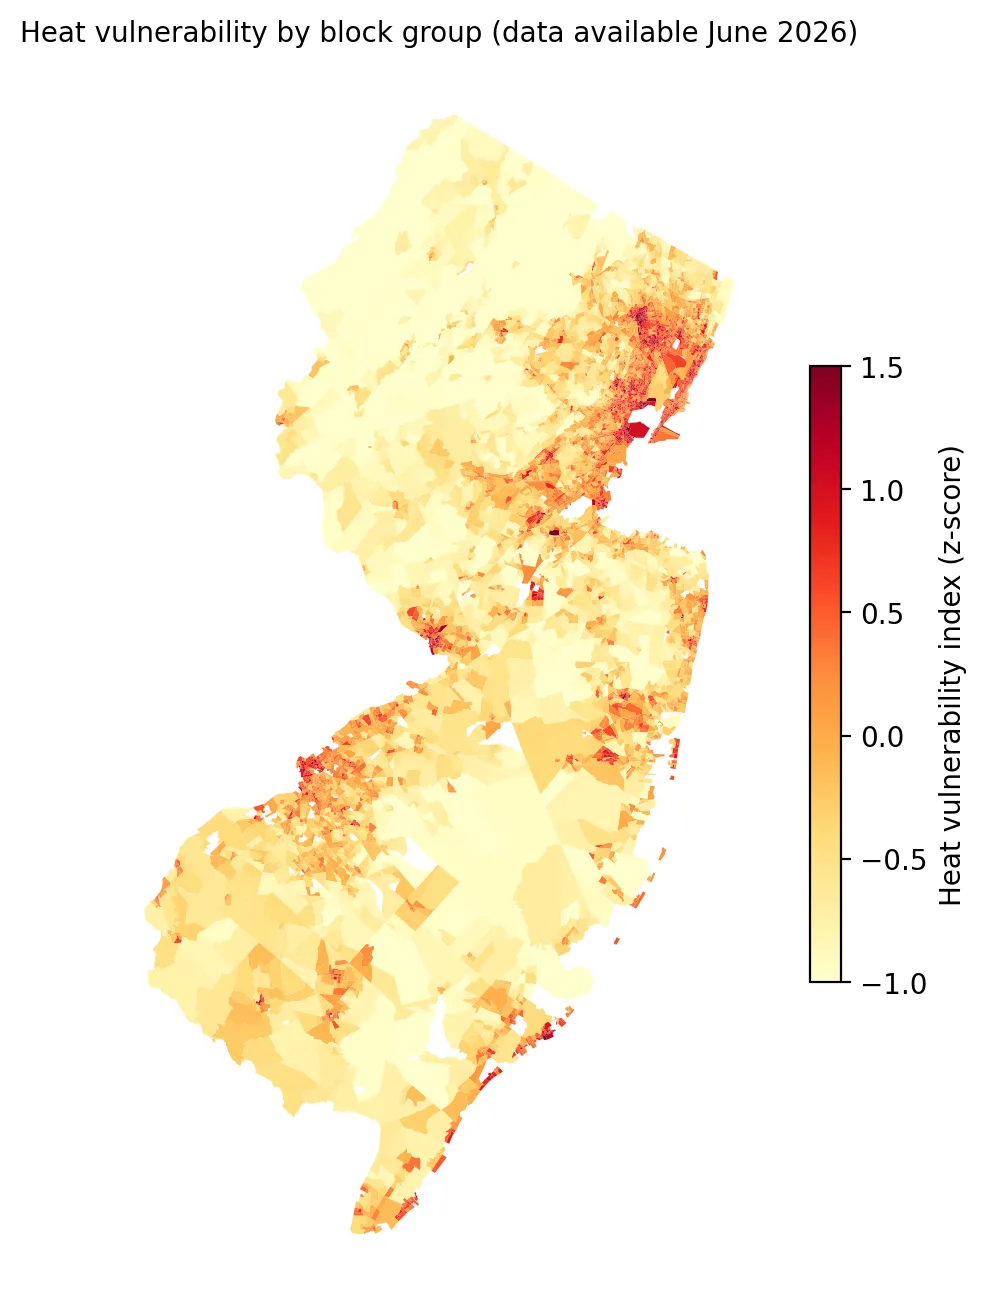
Map of New Jersey block groups shaded by heat vulnerability index from -1 to 1.5. The darkest red areas cluster in the northeast urban core, Trenton, Camden and Atlantic City, while the northwest and Pinelands are pale yellow.

Measuring Heat Vulnerability: Who Is Most at Risk When the Next Heat Wave Hits?

Posted on June 29, 2026

A heat vulnerability index for every New Jersey neighborhood shows who is most at risk in a heat wave and how it overlaps with overburdened communities. (4 min. read)

Continue reading →: Measuring Heat Vulnerability: Who Is Most at Risk When the Next Heat Wave Hits?
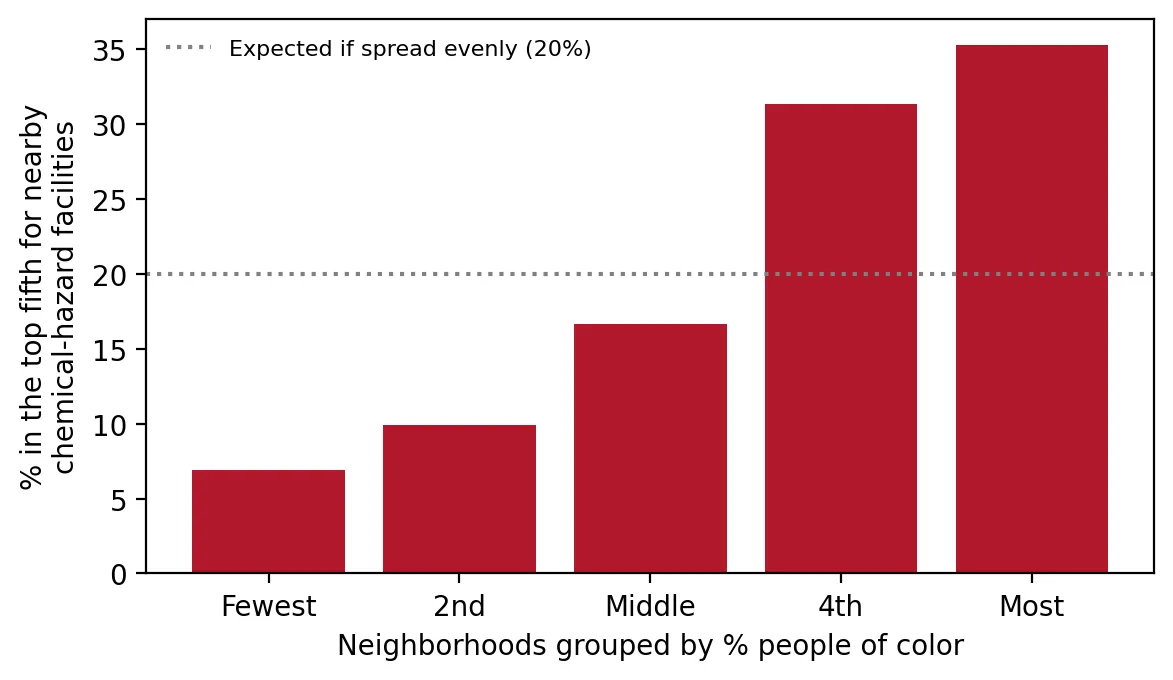
Bar chart of the percent of neighborhoods in the top fifth for nearby chemical-hazard facilities, grouped by share of people of color. The share rises from about 7% in the fewest group to about 35% in the most, crossing the 20% even-spread line at the fourth group.

One Bad Day: Who Lives Near New Jersey's High-Risk Chemical Facilities?

Posted on June 16, 2026

Who lives near New Jersey's high-risk chemical facilities? Overburdened communities are far more likely to, as EPA weighs rolling back safety rules. (4 min. read)

Continue reading →: One Bad Day: Who Lives Near New Jersey's High-Risk Chemical Facilities?
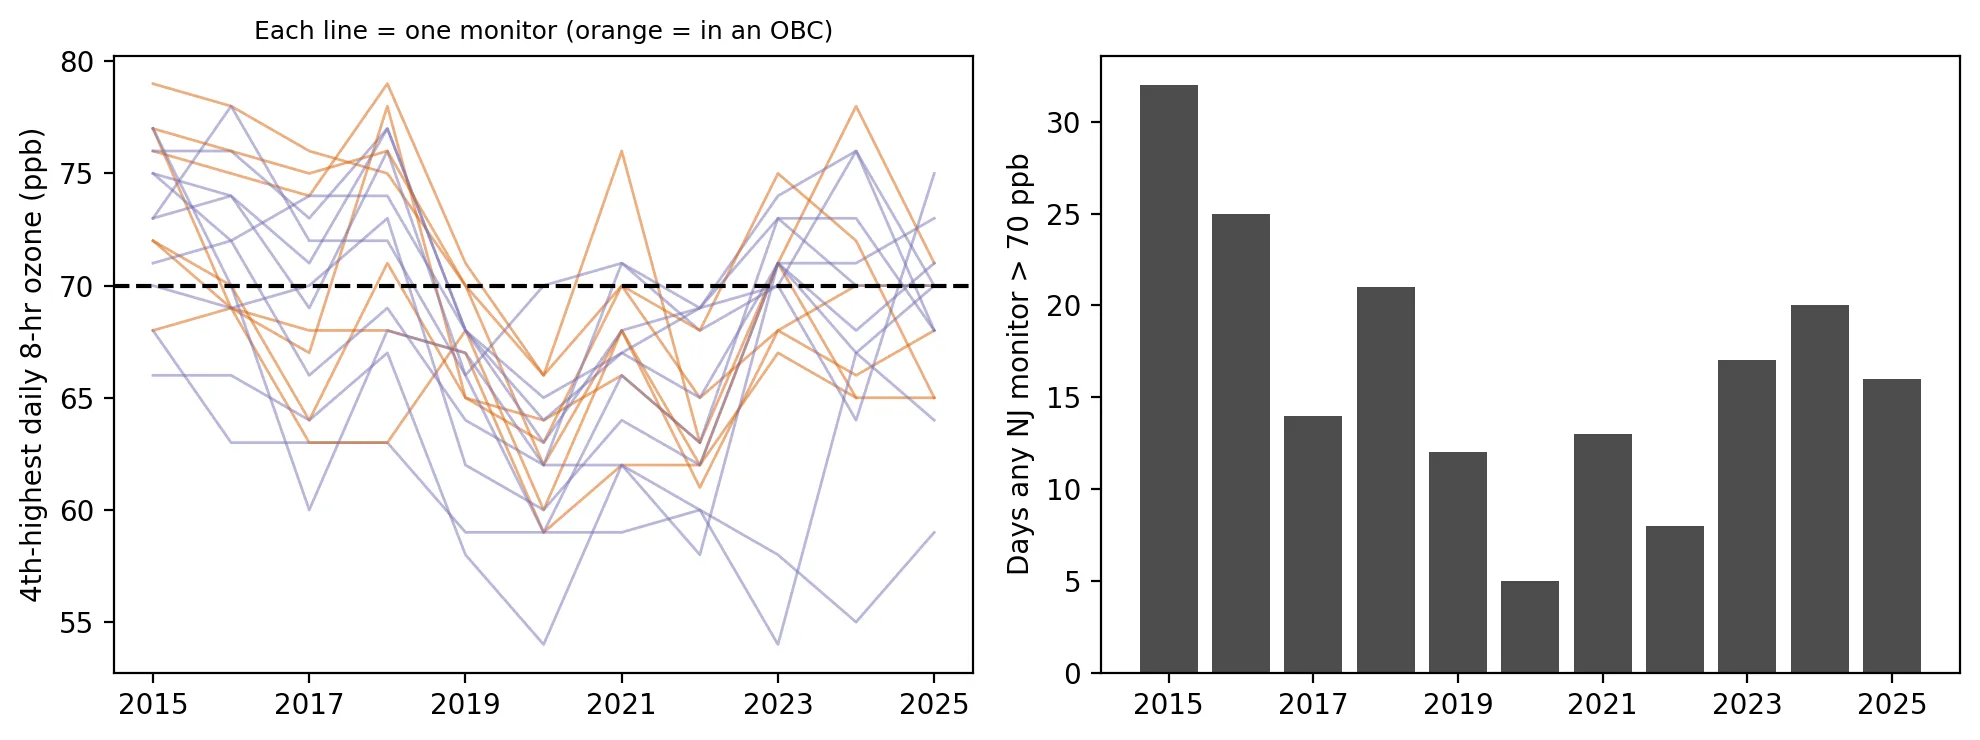
Two panels covering 2015 to 2025. On the left, lines for each monitor's 4th-highest daily 8-hour ozone fall from the mid-70s toward 60 around 2020 and then rise again, crossing the 70 ppb standard line. On the right, bars of days any monitor exceeded 70 ppb drop from 32 in 2015 to 5 in 2020, then rebound to 17, 20 and 16 in 2023 to 2025.

A Decade of Ozone: New Jersey's Progress Has Stalled

Posted on June 4, 2026

New Jersey's ozone fell over the past decade, but progress has stalled since 2020. A look at monitor data from 2015 to 2025 and who shares the burden. (4 min. read)

Continue reading →: A Decade of Ozone: New Jersey's Progress Has Stalled
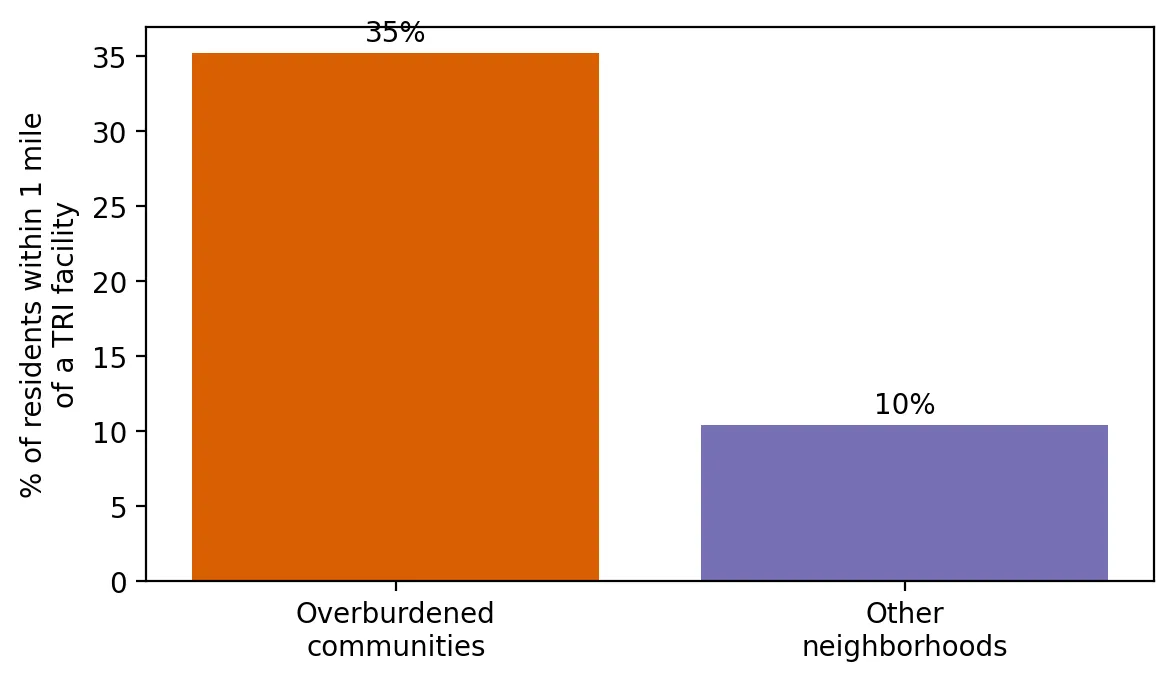
Bar chart of the percent of residents living within 1 mile of a toxic release facility: 35% in overburdened communities versus 10% in other neighborhoods.

Living Next to Industry: Who Lives Within a Mile of a Toxic-Release Facility?

Posted on May 26, 2026

Who lives within a mile of a toxic-release facility in New Jersey? Overburdened communities are far more likely to, even within the same county. (4 min. read)

Continue reading →: Living Next to Industry: Who Lives Within a Mile of a Toxic-Release Facility?
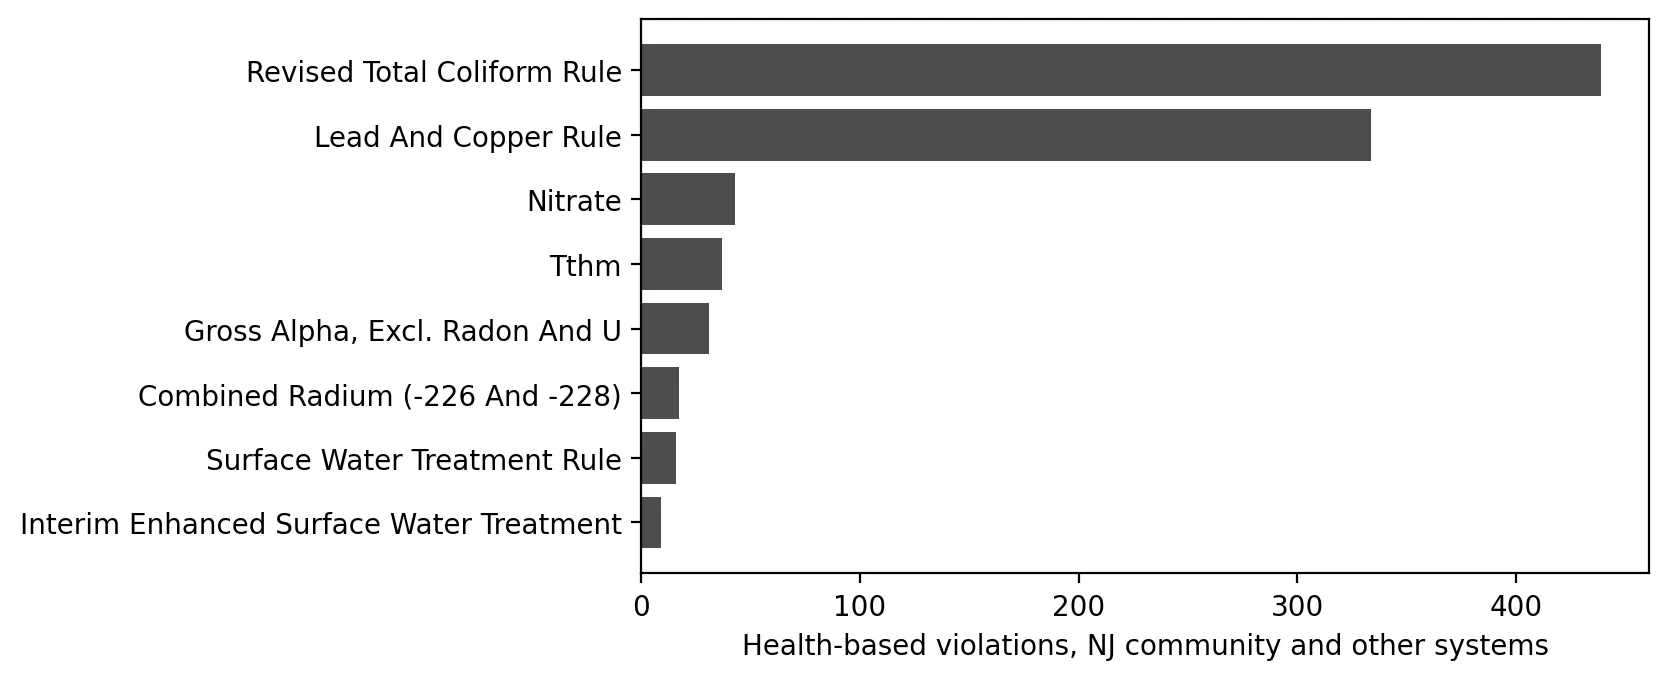
Horizontal bar chart of health-based water violations by type. The Revised Total Coliform Rule (about 440) and Lead and Copper Rule (about 335) dominate, while nitrate, TTHM, gross alpha, radium and surface water rules are each under 45.

Is the Water Safe? Health-Based Drinking Water Violations in New Jersey
Posted on May 7, 2026

Are health-based drinking water violations more common in New Jersey systems that serve overburdened communities? A look at five years of data. (4 min. read)
Continue reading →: Is the Water Safe? Health-Based Drinking Water Violations in New Jersey
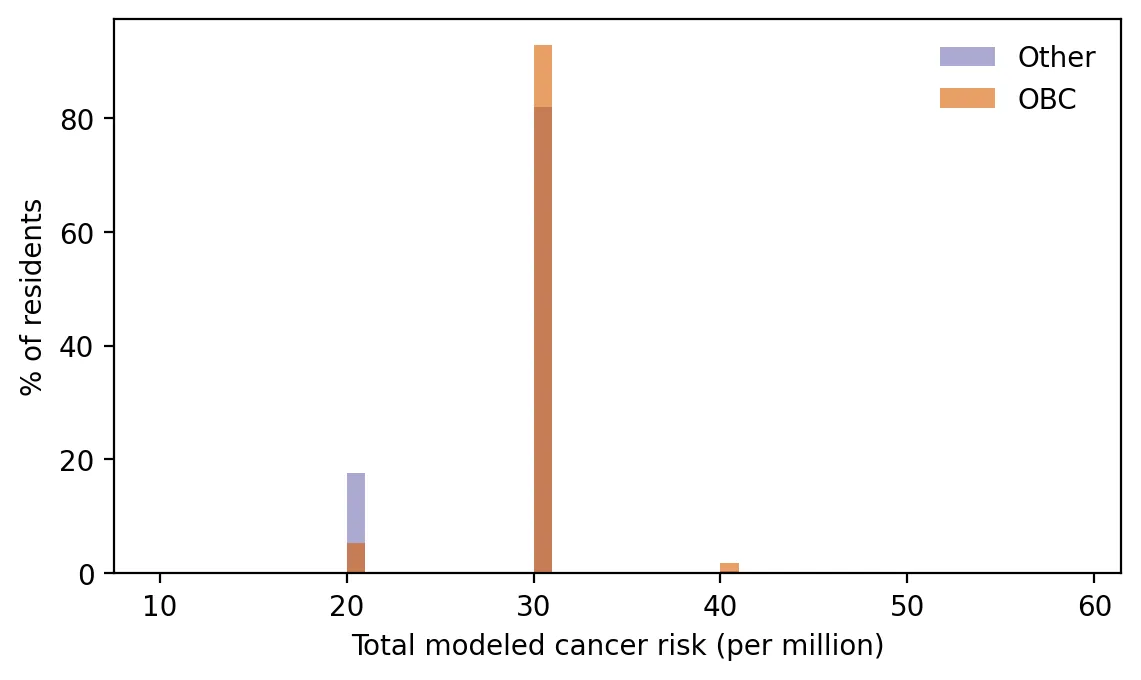
Overlapping histogram of the percent of residents at each level of modeled cancer risk for overburdened and other communities. Nearly everyone falls at about 30 per million, but a larger share of other residents are in the lower group near 20 (about 17% versus 5%), and only overburdened residents appear near 40.

Earth Day 2026: The Air Toxics Picture in New Jersey
Posted on April 22, 2026

Modeled air toxics cancer risk is slightly higher in New Jersey's overburdened communities, and the gap comes from local sources like ports, rail and cars. (4 min. read)

Continue reading →: Earth Day 2026: The Air Toxics Picture in New Jersey
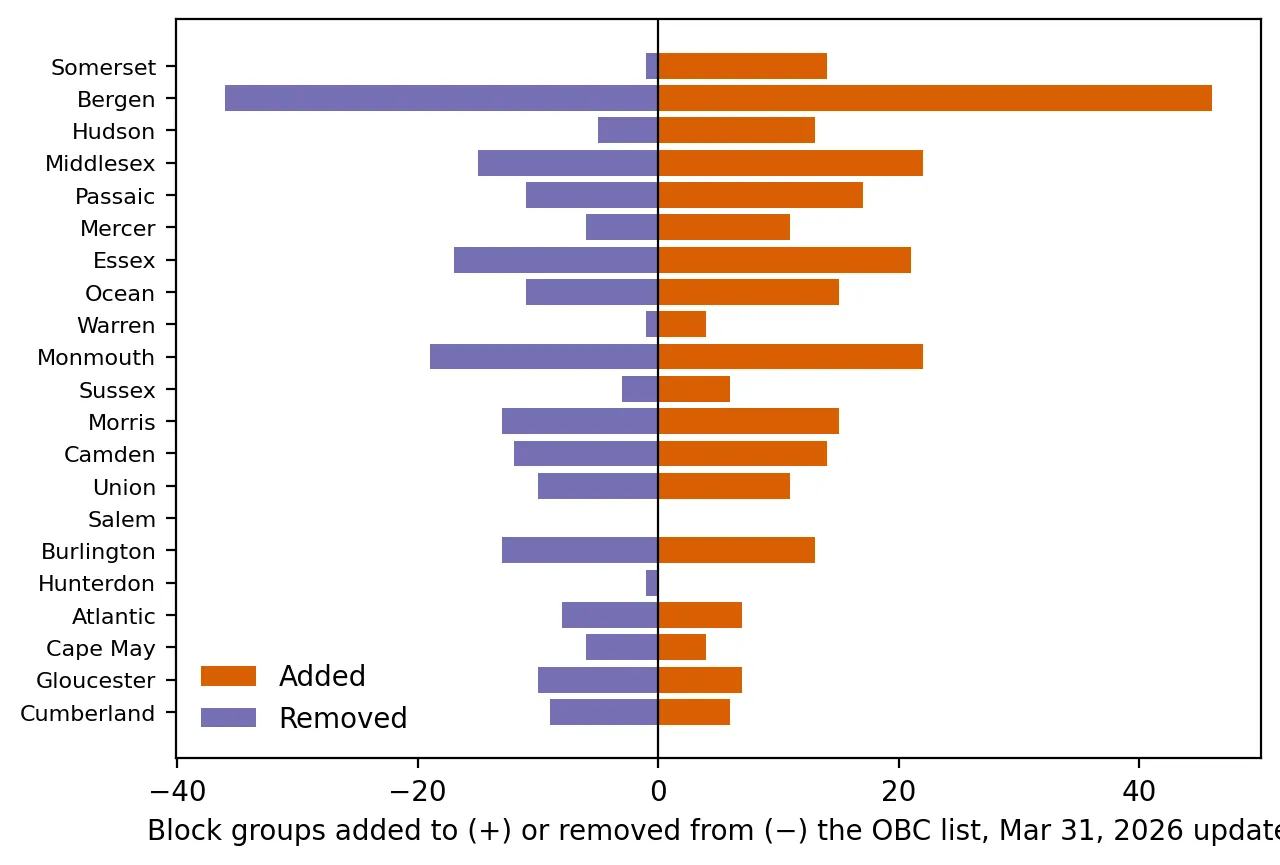
Back-to-back bar chart of block groups added to and removed from the overburdened community list in each county in the March 31, 2026 update. Bergen has the most changes, 46 added and 36 removed, and most counties show both additions and removals; Salem has none.

A New Map of Burden: What Changed When New Jersey Updated Its Overburdened Communities
Posted on April 7, 2026

What changed when New Jersey updated its overburdened communities map, and why some neighborhoods may flip status. (4 min. read)
Continue reading →: A New Map of Burden: What Changed When New Jersey Updated Its Overburdened Communities
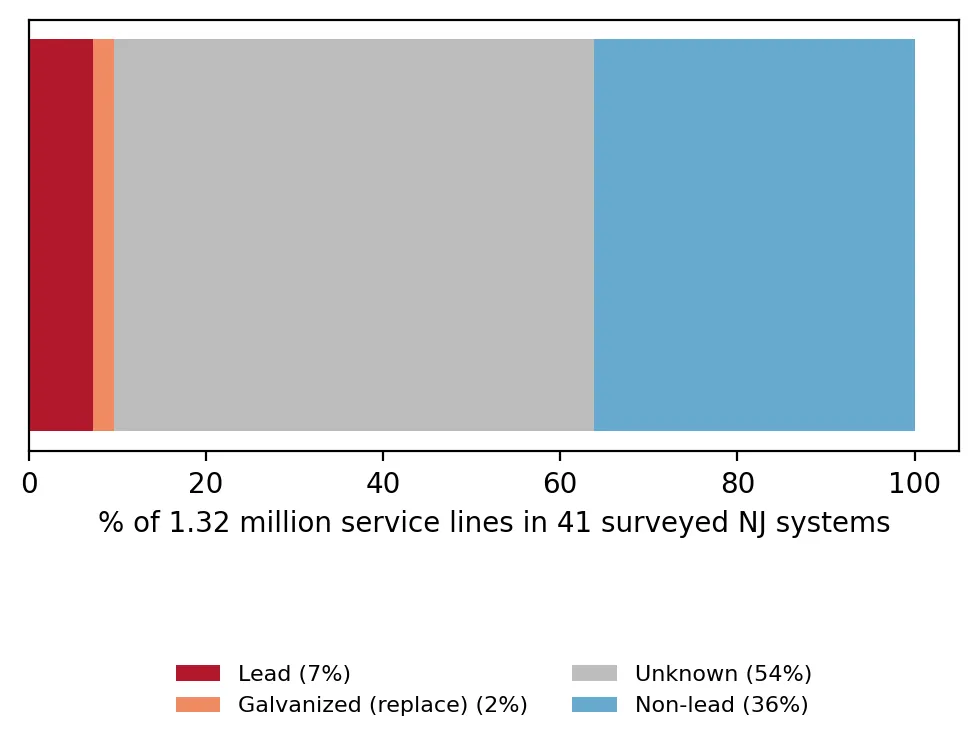
Single stacked bar showing the materials of 1.32 million service lines in 41 surveyed New Jersey water systems: 7% lead, 2% galvanized needing replacement, 54% unknown and 36% non-lead.
Five Years Left: Can New Jersey Replace Its Lead Pipes by 2031?
Posted on March 12, 2026

New Jersey must replace its lead service lines by 2031. How big is the job, and which communities are most affected? (4 min. read)
Continue reading →: Five Years Left: Can New Jersey Replace Its Lead Pipes by 2031?
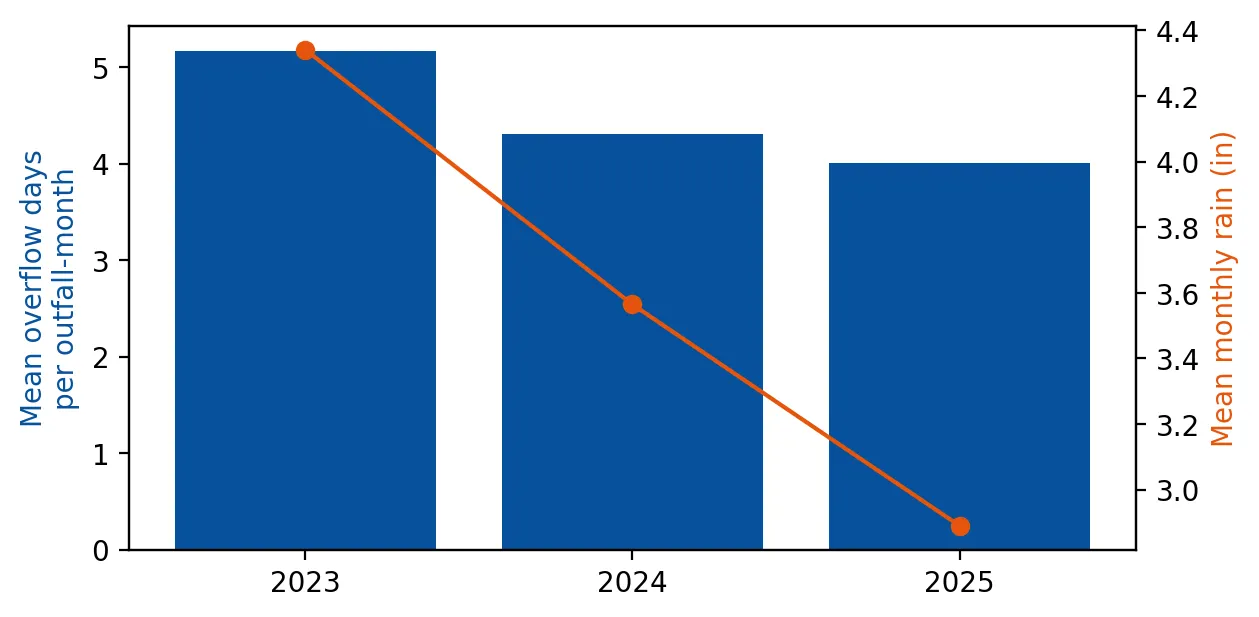
Bar chart of mean overflow days per outfall-month falling from about 5.2 in 2023 to 4.3 in 2024 and 4.0 in 2025, with a line showing mean monthly rain falling from about 4.3 inches to 3.6 and 2.9 inches over the same years.

Sewage in the Rain: After Accounting for Weather, Are New Jersey's Sewer Overflows Declining?

Posted on February 17, 2026

Sewer overflows look like they are falling, but so did rain. A rain-adjusted analysis of New Jersey's combined sewer outfalls. (4 min. read)

Continue reading →: Sewage in the Rain: After Accounting for Weather, Are New Jersey's Sewer Overflows Declining?
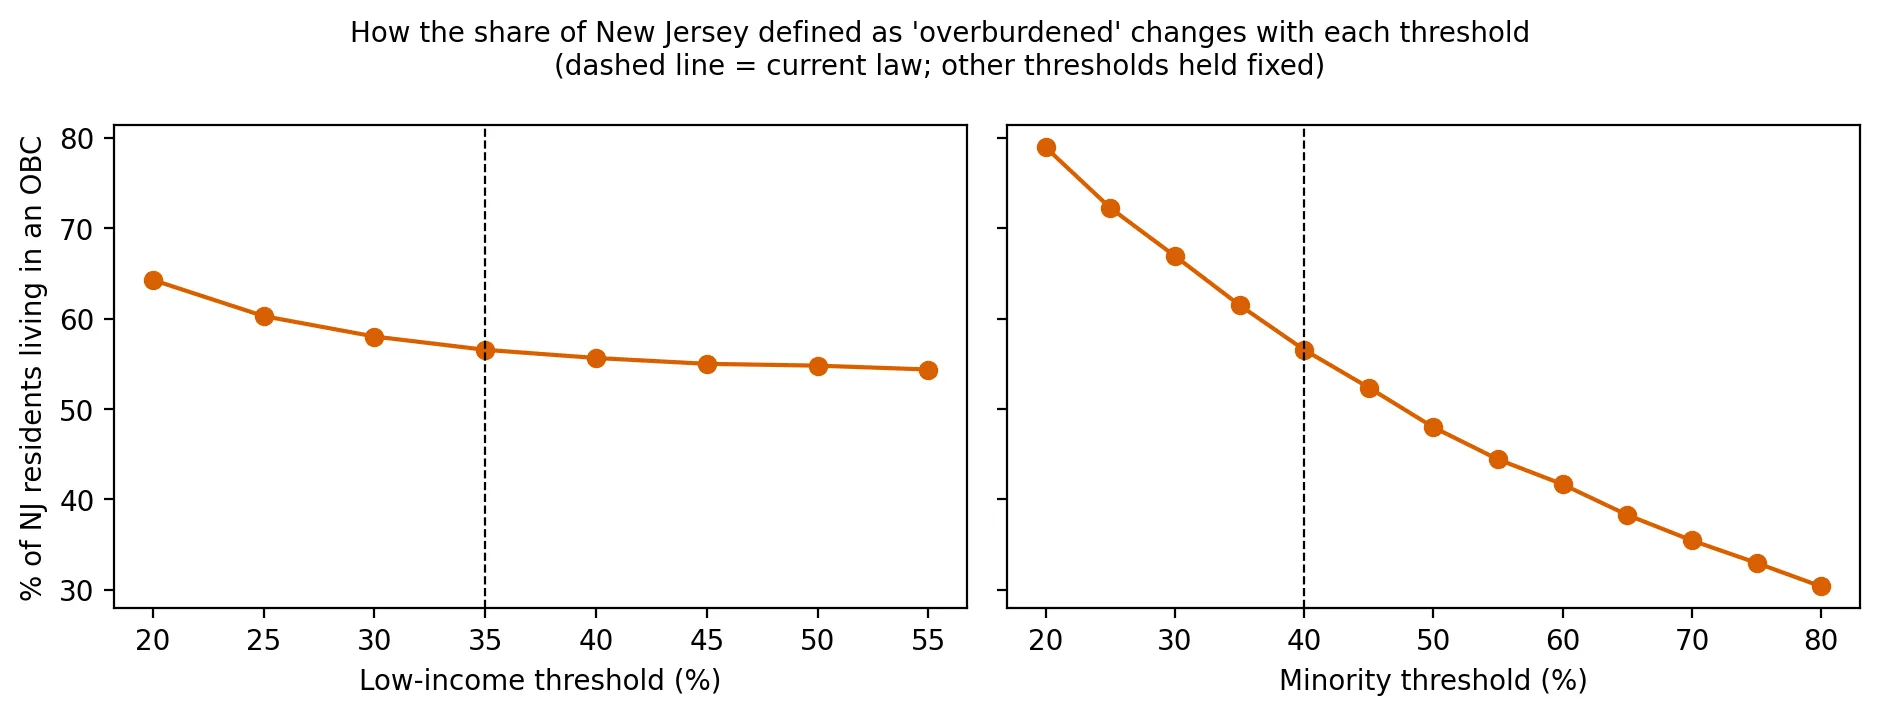
Two line charts showing how the percent of New Jersey residents in overburdened communities changes with each threshold. Changing the low-income threshold from 20% to 55% moves the share only from about 64% to 54%, while raising the minority threshold from 20% to 80% drops it steeply from about 79% to 30%.
Where Do You Draw the Line? How Three Numbers Decide Who Is 'Overburdened'

Posted on January 27, 2026

How much does New Jersey's overburdened-community map depend on three threshold numbers? A sensitivity analysis. (4 min. read)

Continue reading →: Where Do You Draw the Line? How Three Numbers Decide Who Is 'Overburdened'
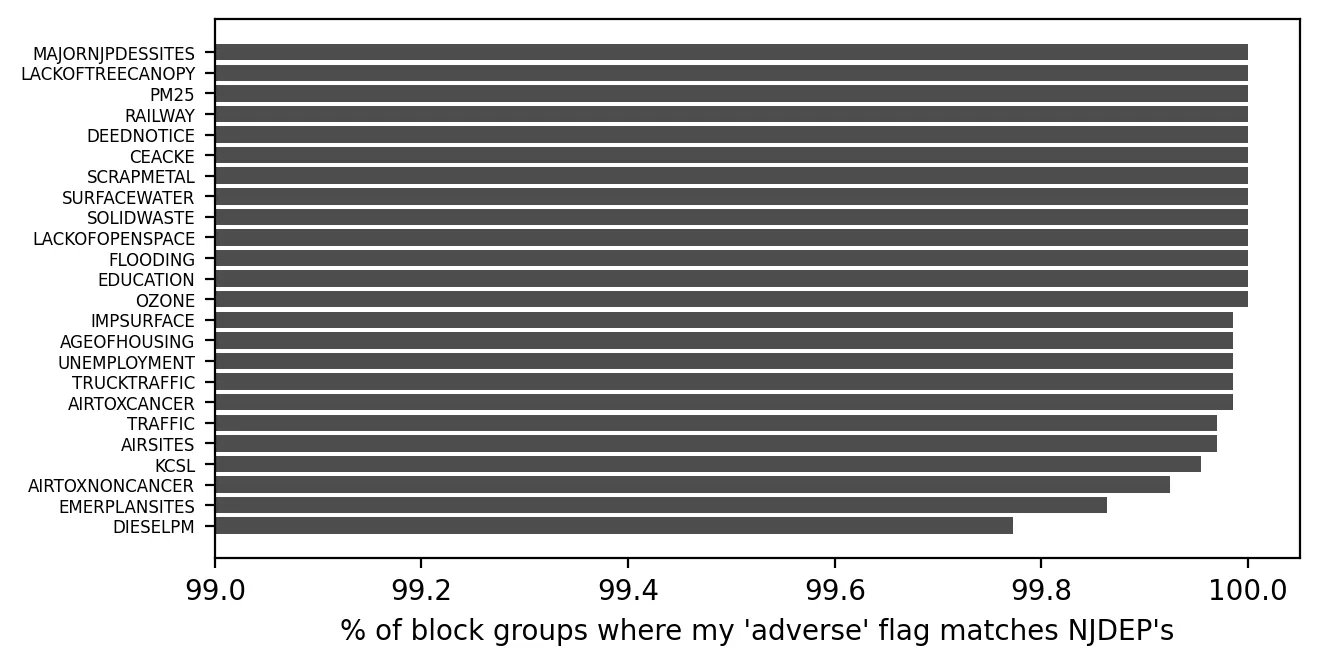
Horizontal bar chart comparing the author's replication of NJDEP's adverse-stressor flags for 22 indicators. Every indicator matches in at least 99.77% of block groups, and most are at or very near 100%; diesel particulate matter is lowest.

The Court Upholds the Rules: What the Appellate Division Decided, and Can We Check NJDEP's Math?

Posted on January 8, 2026

A court upheld New Jersey's environmental justice rules. I also checked whether NJDEP's overburdened-community math can be reproduced. (4 min. read)

Continue reading →: The Court Upholds the Rules: What the Appellate Division Decided, and Can We Check NJDEP's Math?
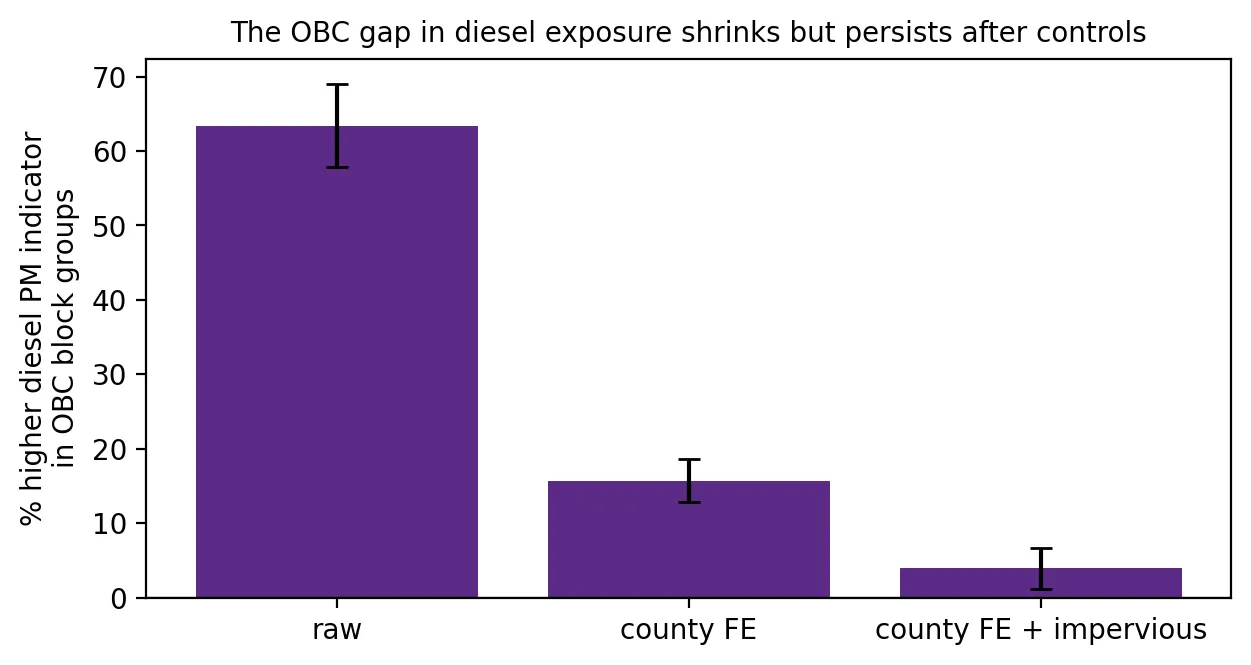
Bar chart of how much higher the diesel particulate indicator is in overburdened block groups under three models. The gap is about 63% with no controls, about 16% within the same county, and about 4% after also controlling for built-up area.

The Warehouse Boom: Are Trucks and Diesel Concentrated in Overburdened Communities?

Posted on December 9, 2025

Are trucks and diesel exhaust concentrated in New Jersey's overburdened communities? A look at the data behind the warehouse boom. (4 min. read)

Continue reading →: The Warehouse Boom: Are Trucks and Diesel Concentrated in Overburdened Communities?
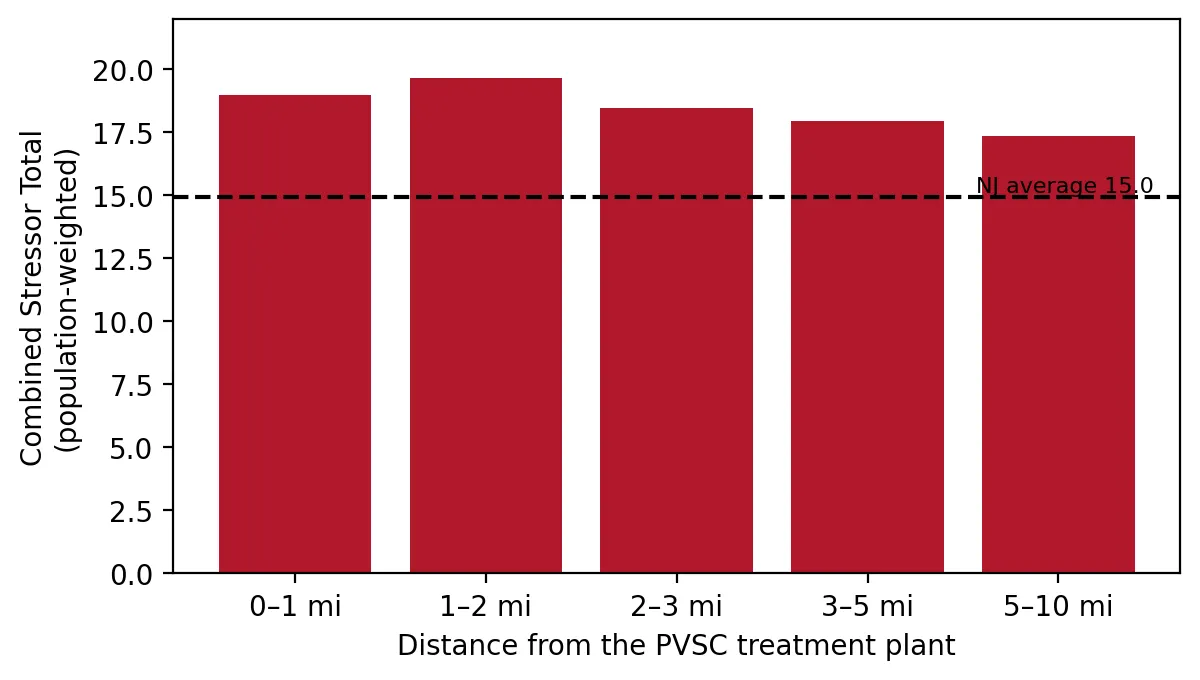
Bar chart of the combined stressor total at five distances from the PVSC treatment plant, from 0-1 mile to 5-10 miles. Every bar (about 17 to 20) is above the New Jersey average of 15.0, with only a slight decline with distance.
The Ironbound's Fourth Power Plant: A Court Hits Pause

Posted on November 10, 2025

A court paused a fourth power plant in Newark's Ironbound. Distance-ring data show how much pollution burden surrounds the site. (4 min. read)

Continue reading →: The Ironbound's Fourth Power Plant: A Court Hits Pause
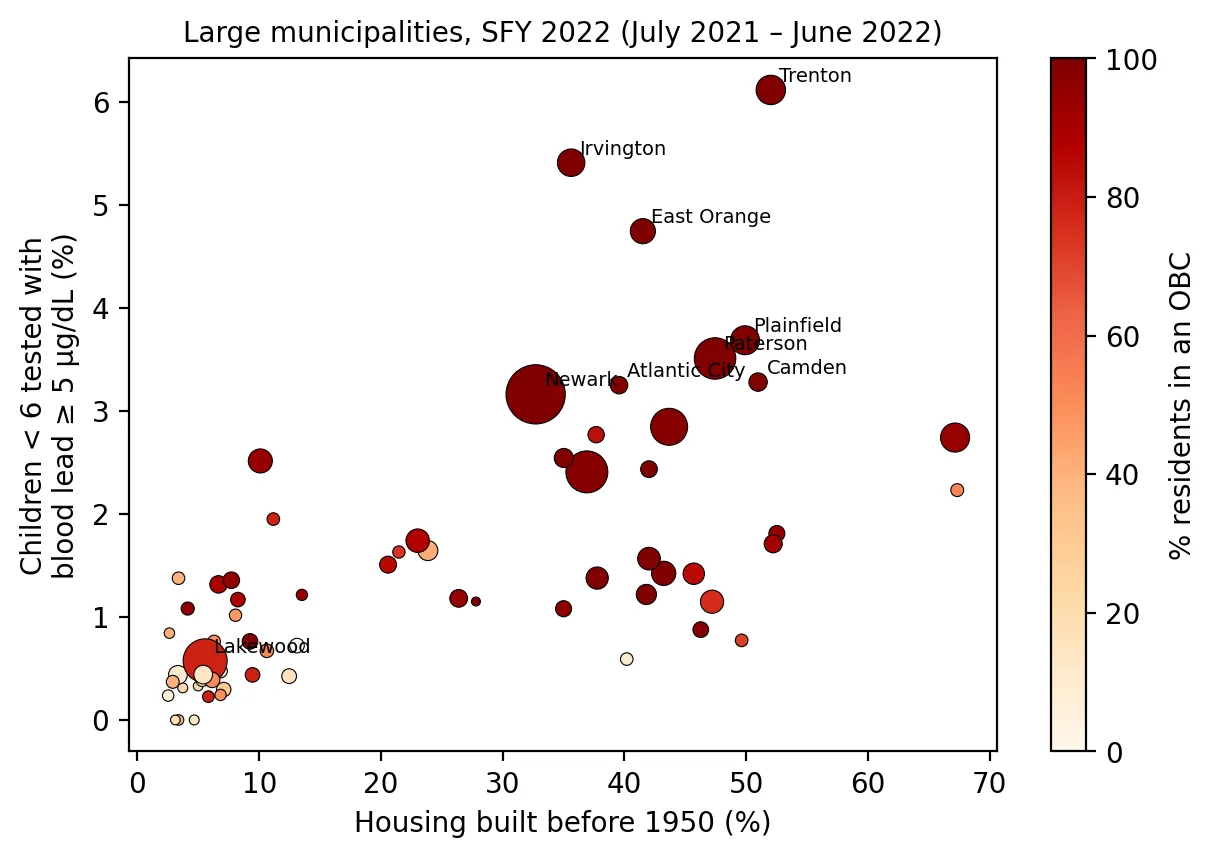
Scatter plot of large New Jersey municipalities, with the share of housing built before 1950 on the horizontal axis and the percent of tested children under 6 with elevated blood lead on the vertical axis. Towns with more old housing tend to have higher lead rates, and the highest points (Trenton about 6%, Irvington, East Orange) are almost entirely overburdened communities.

Lead in Children's Blood: What the State's Newest Report Showed, and Why It Was Already Three Years Old

Posted on October 14, 2025

New Jersey's newest childhood lead report was three years old. Here is where elevated blood lead is concentrated and why. (4 min. read)

Continue reading →: Lead in Children's Blood: What the State's Newest Report Showed, and Why It Was Already Three Years Old
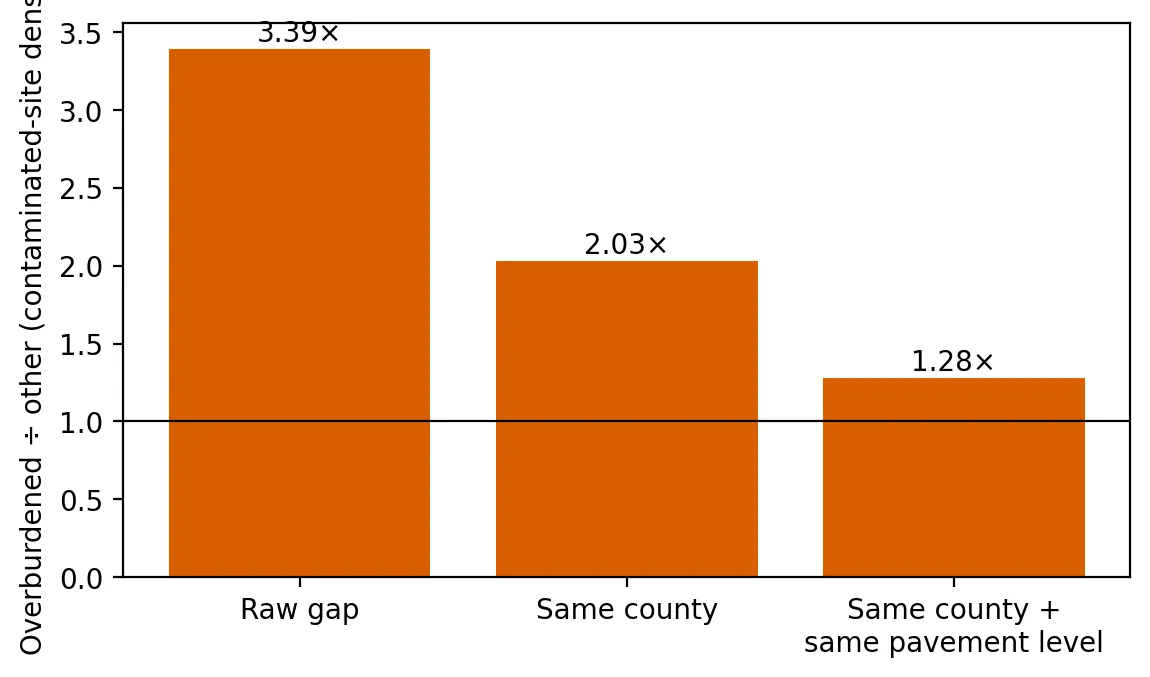
Bar chart of how many times higher contaminated-site density is in overburdened than other neighborhoods: 3.39 times in the raw comparison, 2.03 times within the same county, and 1.28 times within the same county and at the same pavement level, all above the line at 1.

Five Years After the EJ Law: Contaminated Sites Next Door

Posted on September 2, 2025

Do overburdened communities have more contaminated sites nearby even within the same county? A test of New Jersey's data. (4 min. read)

Continue reading →: Five Years After the EJ Law: Contaminated Sites Next Door
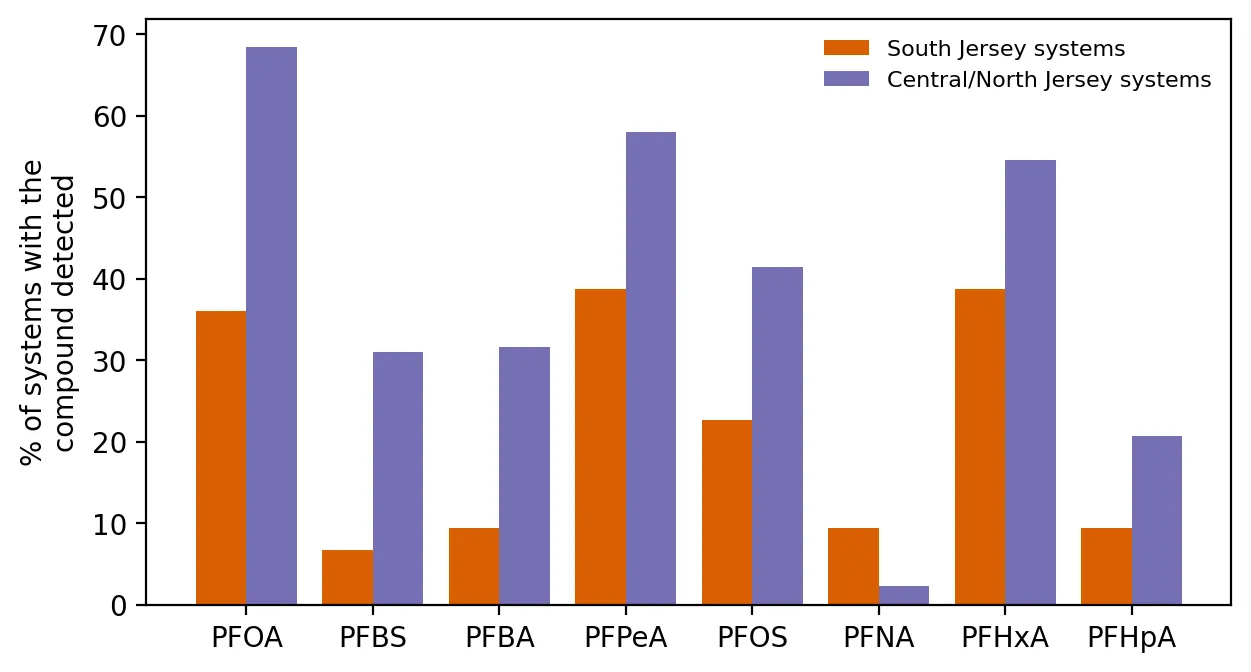
Paired bar chart of the percent of public water systems detecting each of eight PFAS compounds, South Jersey versus Central/North Jersey. Central/North Jersey is higher for seven compounds, for example PFOA at about 68% versus 36%, but PFNA is higher in South Jersey at 9% versus 2%.

Chemical Fingerprints: What the DuPont Settlement Means, and What South Jersey's Water Shows

Posted on August 18, 2025

Drinking water data show different PFAS chemical fingerprints in South Jersey, and what the DuPont settlement means for nearby communities. (4 min. read)

Continue reading →: Chemical Fingerprints: What the DuPont Settlement Means, and What South Jersey's Water Shows
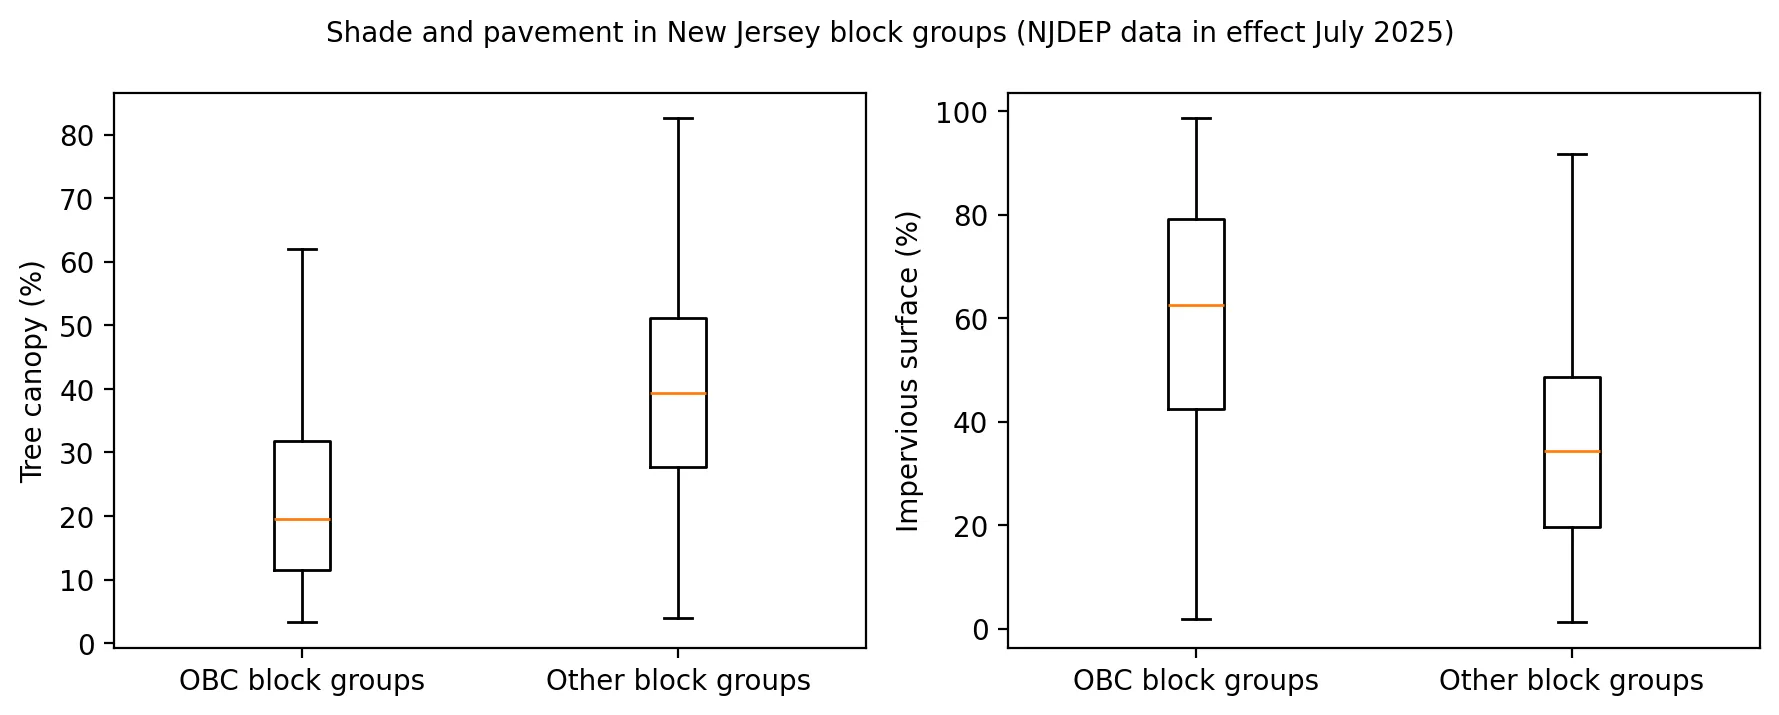
Two box plots comparing overburdened and other block groups. Median tree canopy is about 20% in overburdened block groups versus about 39% in others, while median impervious surface is about 62% versus about 34%.

Planting Shade: Where New Jersey's New Heat Program Could Do the Most Good

Posted on July 22, 2025

Where New Jersey is shortest on shade, and what tree canopy and pavement data suggest for the state's new urban heat program. (4 min. read)

Continue reading →: Planting Shade: Where New Jersey's New Heat Program Could Do the Most Good
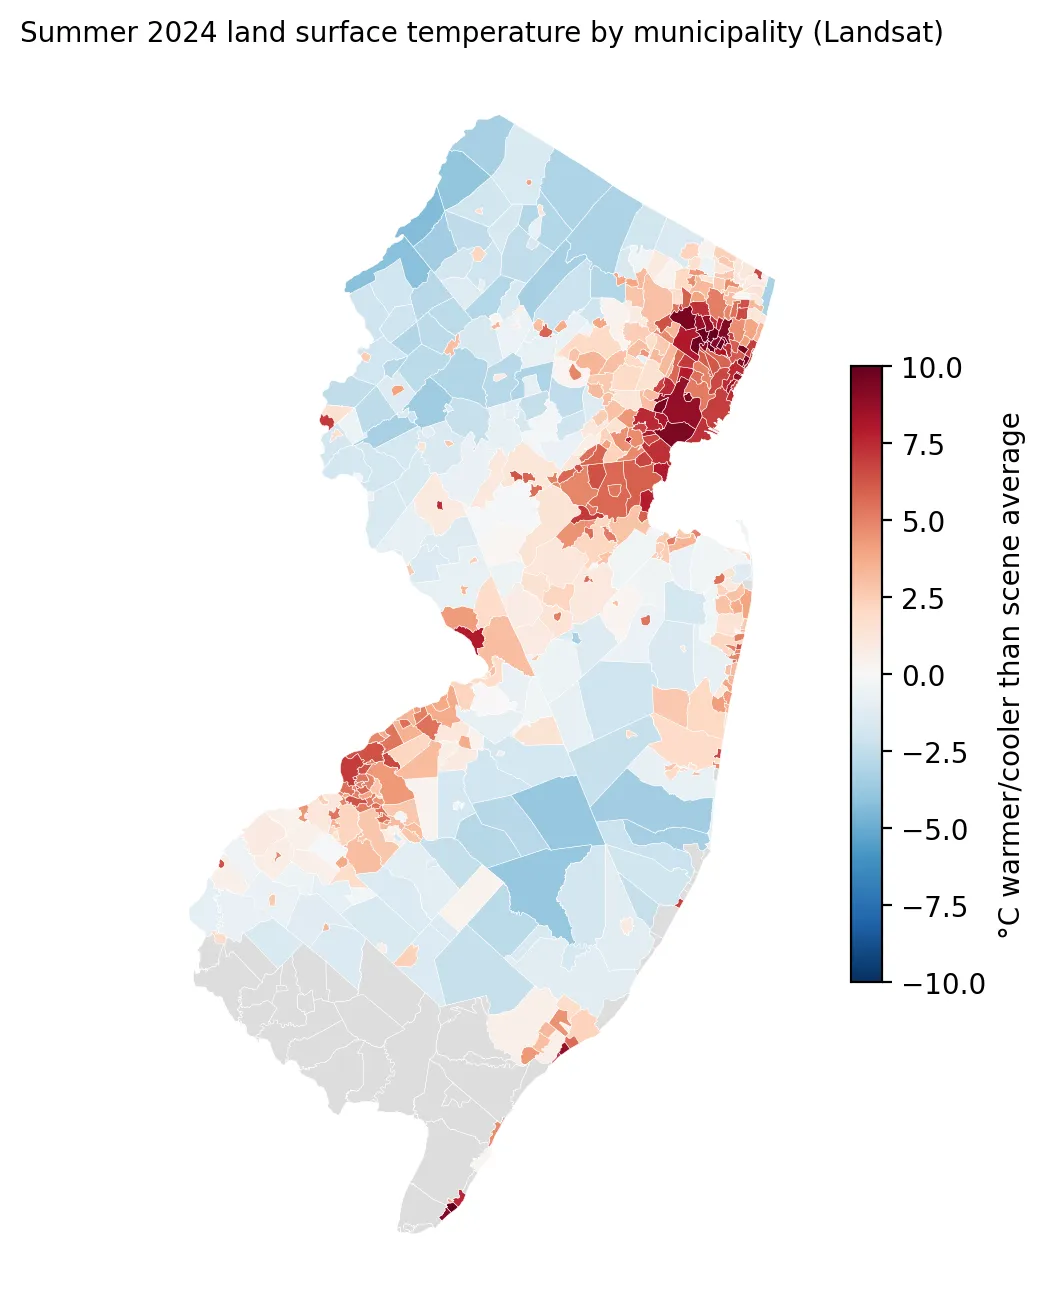
Map of New Jersey colored by summer 2024 surface temperature compared with the scene average for each municipality. The hottest places, up to about 10 degrees C warmer, are in the northeast around Newark and Paterson and near Camden, while the northwest and Pinelands are cooler.

Hottest in the City: What Satellites Show About Heat in New Jersey's Towns

Posted on June 27, 2025

Satellite data show which New Jersey towns run hottest in summer, and why pavement matters more than anything else. (4 min. read)

Continue reading →: Hottest in the City: What Satellites Show About Heat in New Jersey's Towns
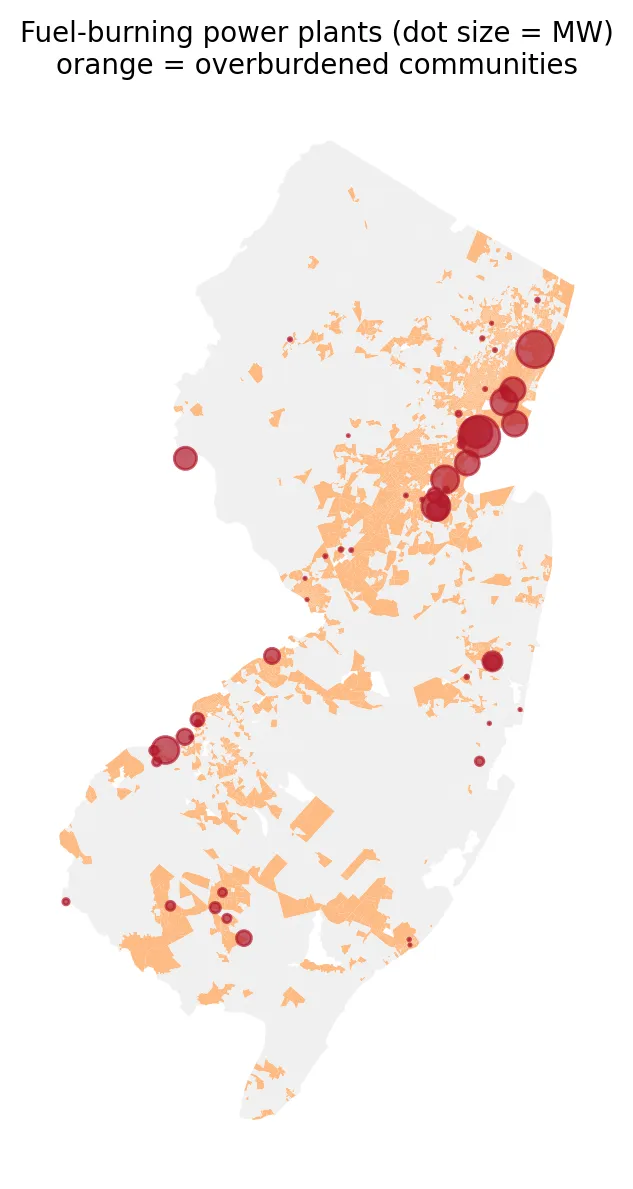
Map of New Jersey showing 55 fuel-burning power plants as red dots sized by megawatts over orange overburdened communities. The largest dots cluster in the dense orange northeast, with others along the Delaware River in the southwest.

The Plants Behind the Bill: Who Lives Next to New Jersey's Power Plants?

Posted on June 10, 2025

Who lives next to New Jersey's fuel-burning power plants? Overburdened communities are about three times as likely to live near one. (4 min. read)

Continue reading →: The Plants Behind the Bill: Who Lives Next to New Jersey's Power Plants?
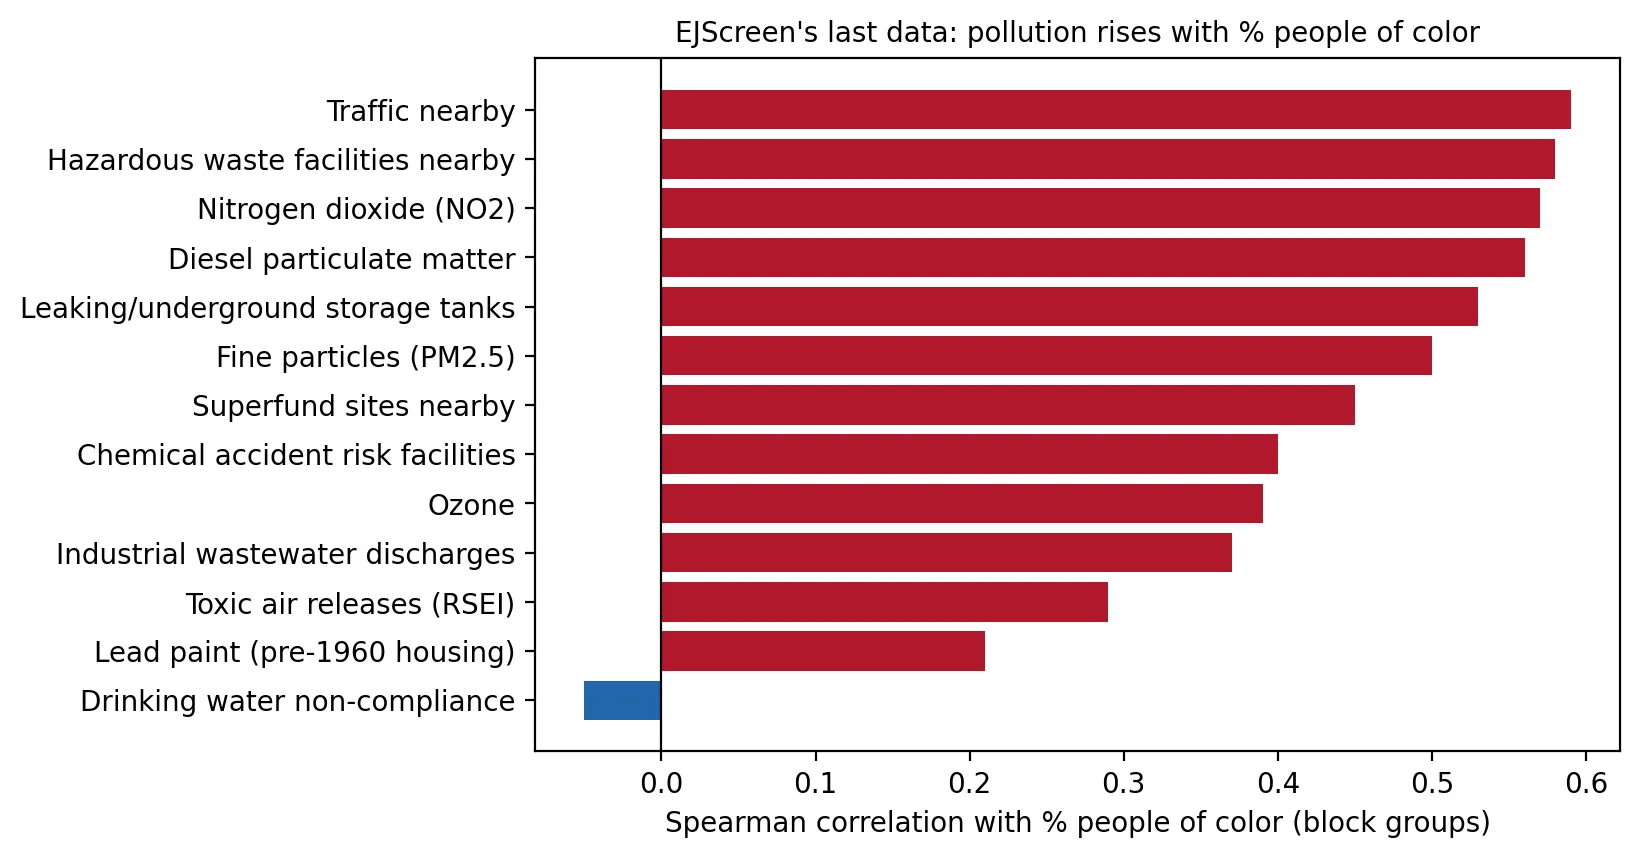
Horizontal bar chart of the rank correlation between 13 pollution indicators and the share of people of color in New Jersey neighborhoods. Twelve are positive, from 0.59 for nearby traffic to 0.21 for lead paint, while drinking water non-compliance is slightly negative at -0.05.

The Map EPA Took Down: What EJScreen's Last Data Showed About New Jersey

Posted on May 20, 2025

What did EPA's EJScreen, taken down in February 2025, show about New Jersey? A look at 13 pollution indicators and the share of people of color. (4 min. read)

Continue reading →: The Map EPA Took Down: What EJScreen's Last Data Showed About New Jersey
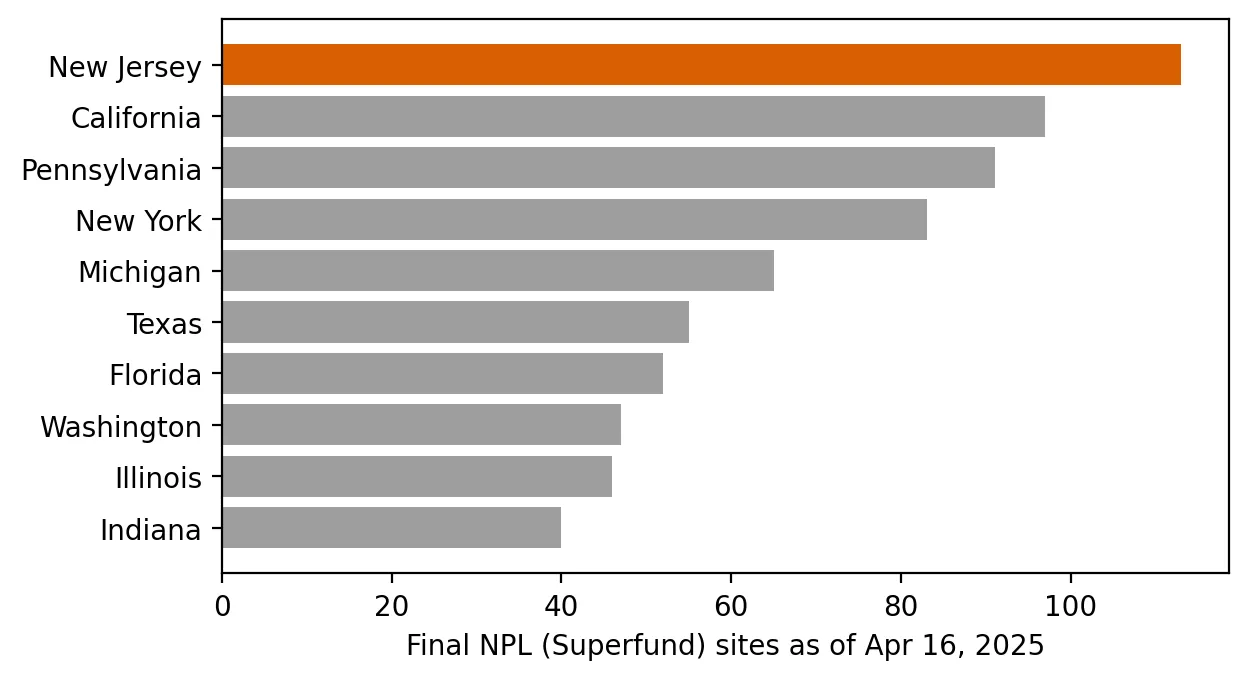
Horizontal bar chart of final Superfund sites by state as of April 16, 2025, led by New Jersey with 113, then California (97), Pennsylvania (91), and New York (83), down to Indiana at about 40.

Superfund State: Who Lives Near New Jersey's 113 Most Hazardous Sites?

Posted on April 16, 2025

New Jersey has more Superfund sites than any other state. Who lives within a mile of them? A look at proximity in overburdened communities. (4 min. read)

Continue reading →: Superfund State: Who Lives Near New Jersey's 113 Most Hazardous Sites?
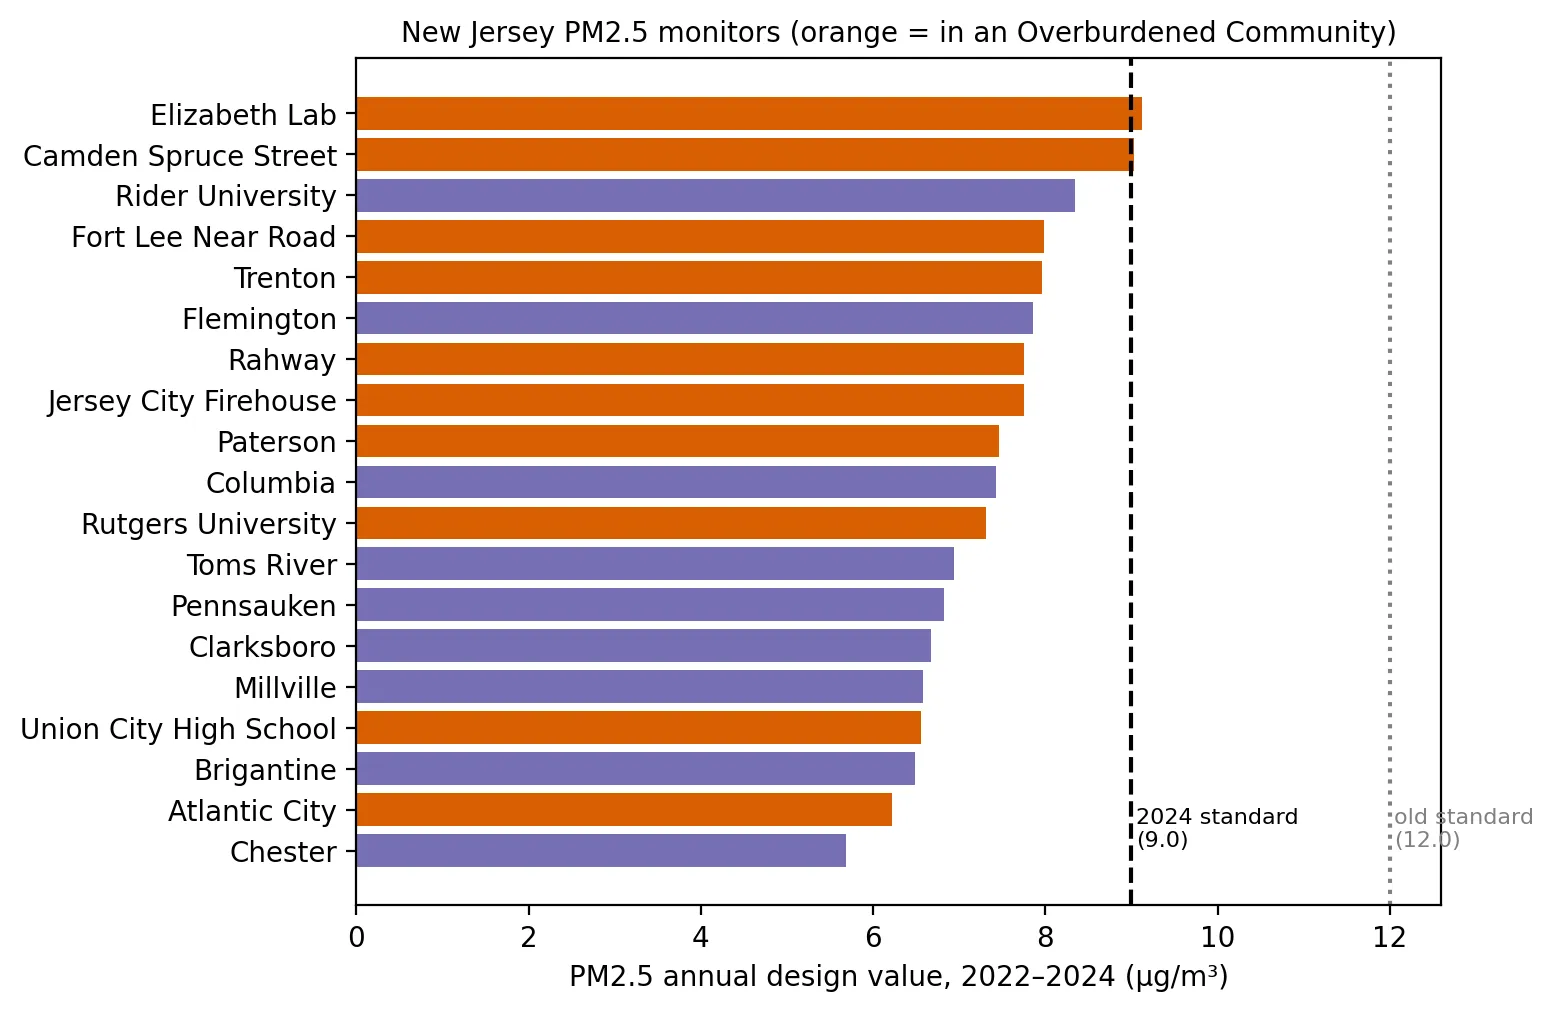
Horizontal bar chart of PM2.5 annual design values for 19 New Jersey monitors, 2022 to 2024. Elizabeth Lab (9.1) and Camden Spruce Street (9.0) reach the 9.0 standard line; all others are lower, down to 5.7 at Chester, and every monitor is well under the old 12.0 standard.

The Soot Standard Under Review: Where New Jersey Stands on Fine Particle Pollution

Posted on March 18, 2025

Where does New Jersey stand on the fine particle (PM2.5) standard that EPA announced it would reconsider? A look at monitor data across the state. (4 min. read)

Continue reading →: The Soot Standard Under Review: Where New Jersey Stands on Fine Particle Pollution
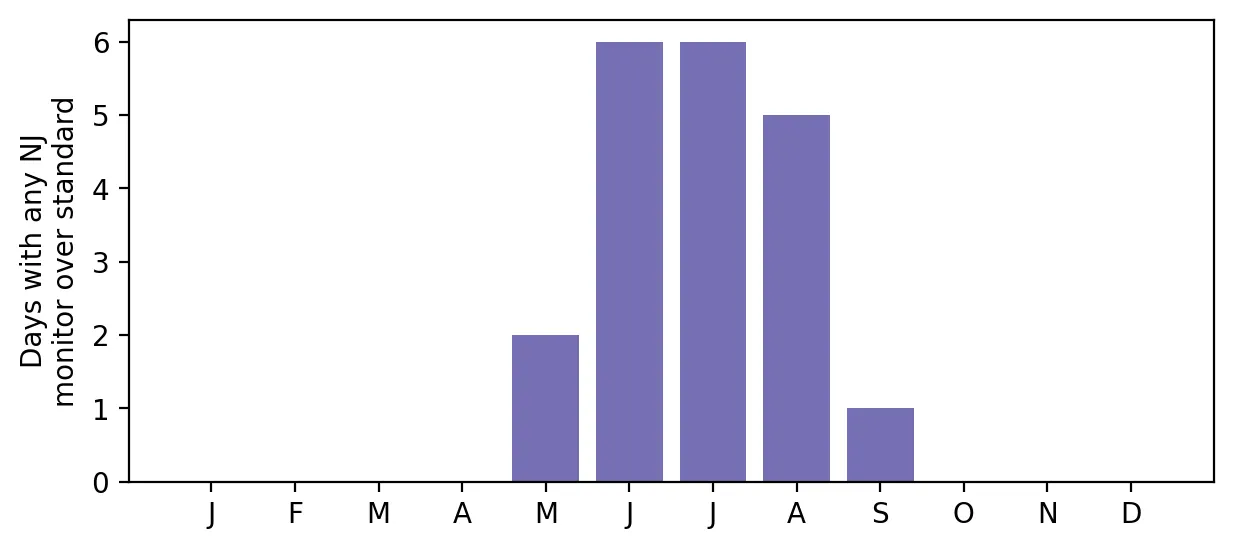
Bar chart of days in 2024 when any New Jersey monitor exceeded the ozone standard, by month: 2 in May, 6 in June, 6 in July, 5 in August, 1 in September, and none in other months.

Ozone Season 2024: How Often Did New Jersey's Air Fail the Federal Standard?

Posted on February 12, 2025

How often did New Jersey's air fail the federal ozone standard in 2024? A look at monitor data and why ozone is shared more widely than other pollutants. (4 min. read)

Continue reading →: Ozone Season 2024: How Often Did New Jersey's Air Fail the Federal Standard?
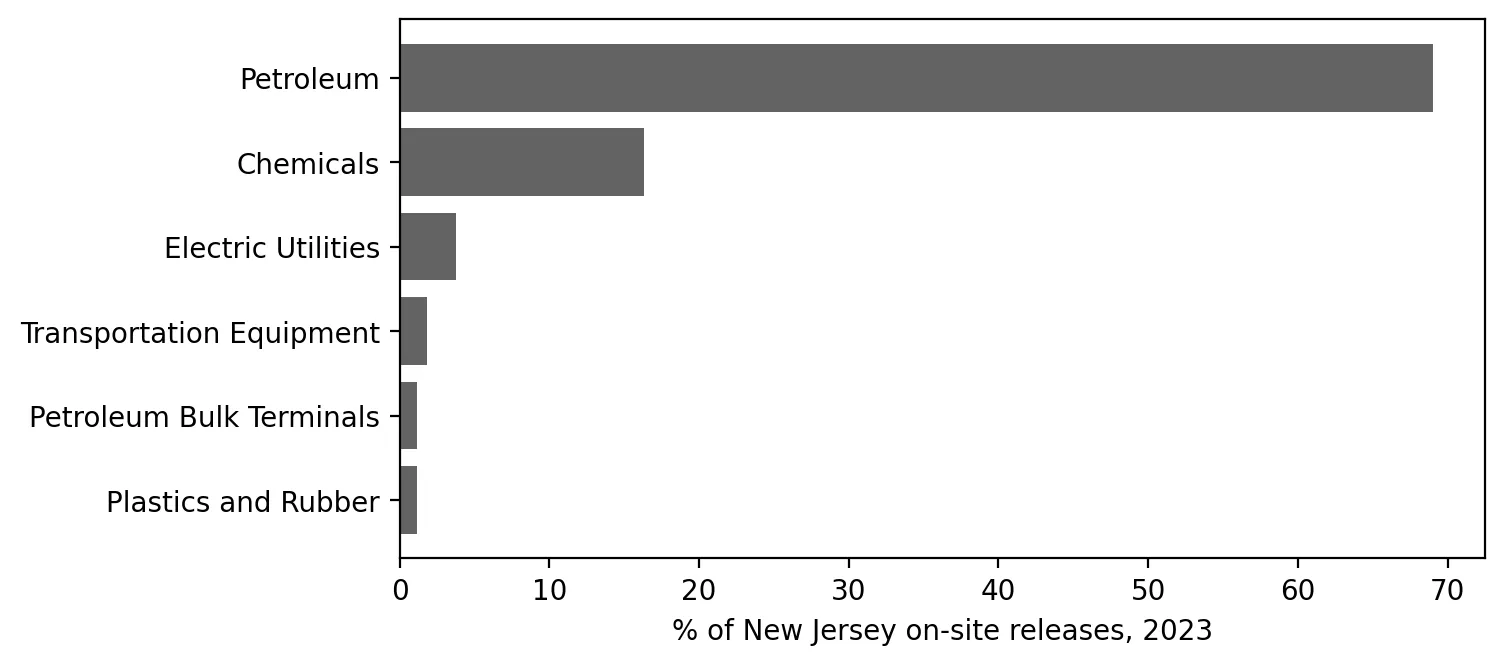
Horizontal bar chart of each industry's share of New Jersey on-site toxic releases in 2023: petroleum about 69%, chemicals about 16%, and all other sectors shown under 4% each.

What Do New Jersey's Factories Report Releasing? A First Look at the Toxics Release Inventory

Posted on January 22, 2025

A first look at what New Jersey's factories report releasing in the Toxics Release Inventory, and why pounds are not the same as harm. (4 min. read)

Continue reading →: What Do New Jersey's Factories Report Releasing? A First Look at the Toxics Release Inventory
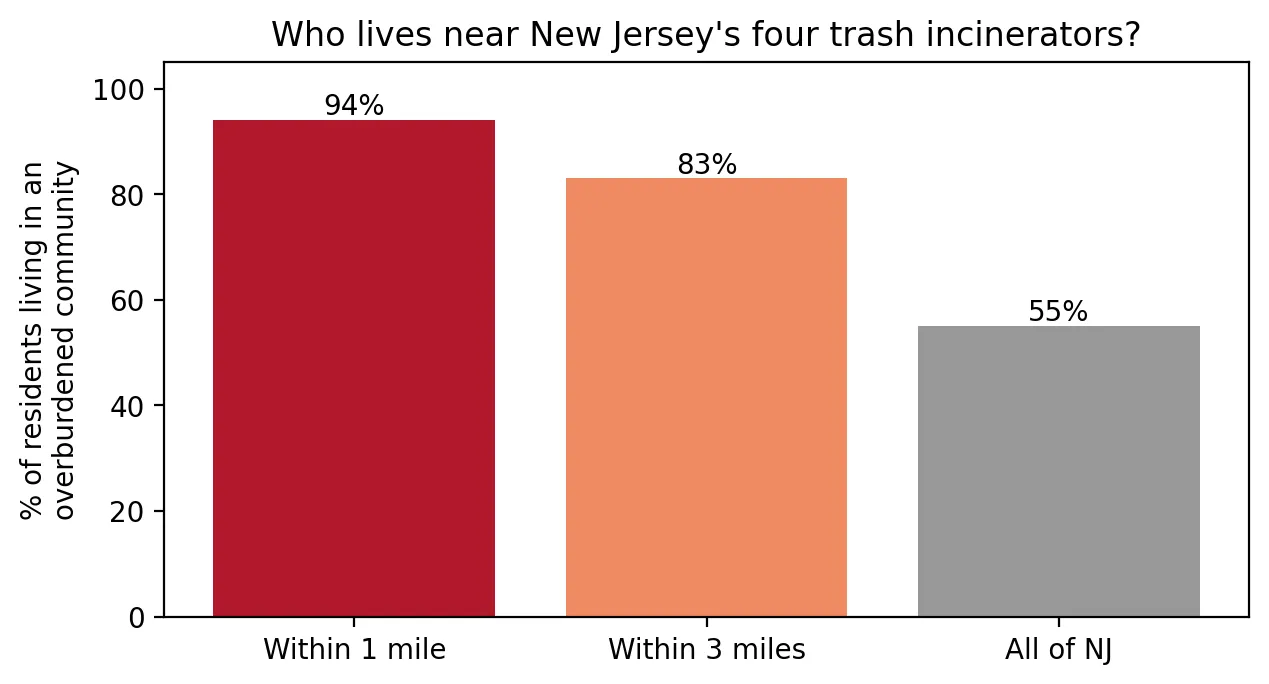
Bar chart of the percent of residents living in an overburdened community: 94% within 1 mile of a New Jersey trash incinerator, 83% within 3 miles, and 55% across all of New Jersey.

Burning Trash Next Door: Who Lives Near New Jersey's Incinerators?

Posted on December 16, 2024

Who lives near New Jersey's four trash incinerators? Nearly everyone within a mile lives in an overburdened community. (3 min. read)

Continue reading →: Burning Trash Next Door: Who Lives Near New Jersey's Incinerators?
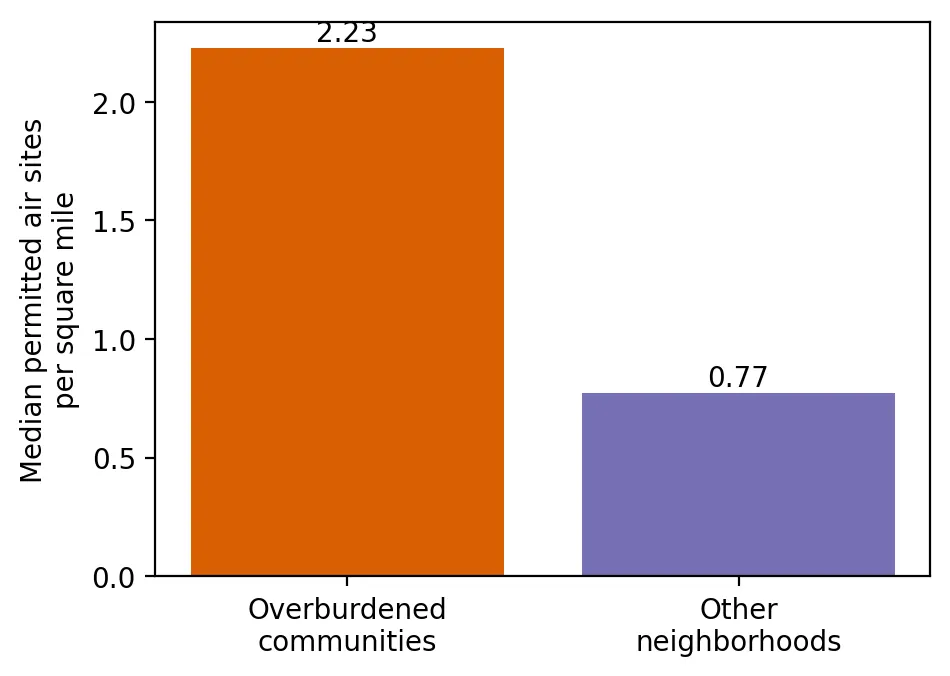
Bar chart of the median number of permitted air pollution sites per square mile: 2.23 in overburdened communities versus 0.77 in other neighborhoods.

Licensed to Pollute: Who Lives Among New Jersey's Permitted Air Pollution Sources?

Posted on October 15, 2024

Who lives among New Jersey's permitted air pollution sources? Overburdened communities have far more of them per square mile than other neighborhoods. (3 min. read)

Continue reading →: Licensed to Pollute: Who Lives Among New Jersey's Permitted Air Pollution Sources?
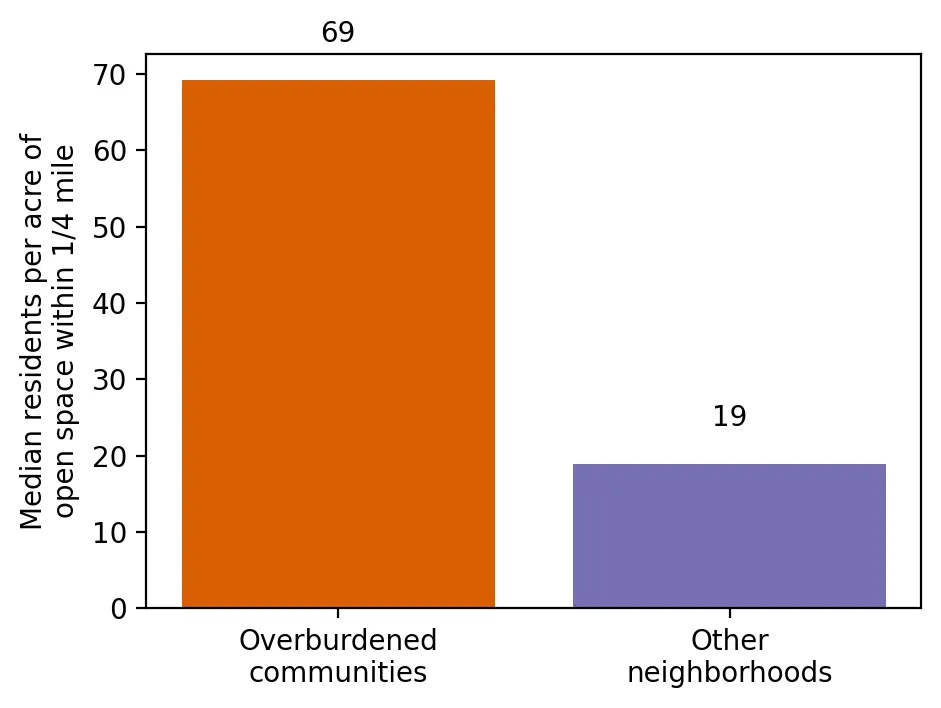
Bar chart of the median number of residents per acre of open space within a quarter mile: 69 in overburdened communities versus 19 in other neighborhoods.

Room to Breathe: Who Has Parks and Open Space Nearby?

Posted on July 16, 2024

Who has parks and open space nearby? Comparing park access in New Jersey's overburdened communities and other neighborhoods, county by county. (3 min. read)

Continue reading →: Room to Breathe: Who Has Parks and Open Space Nearby?
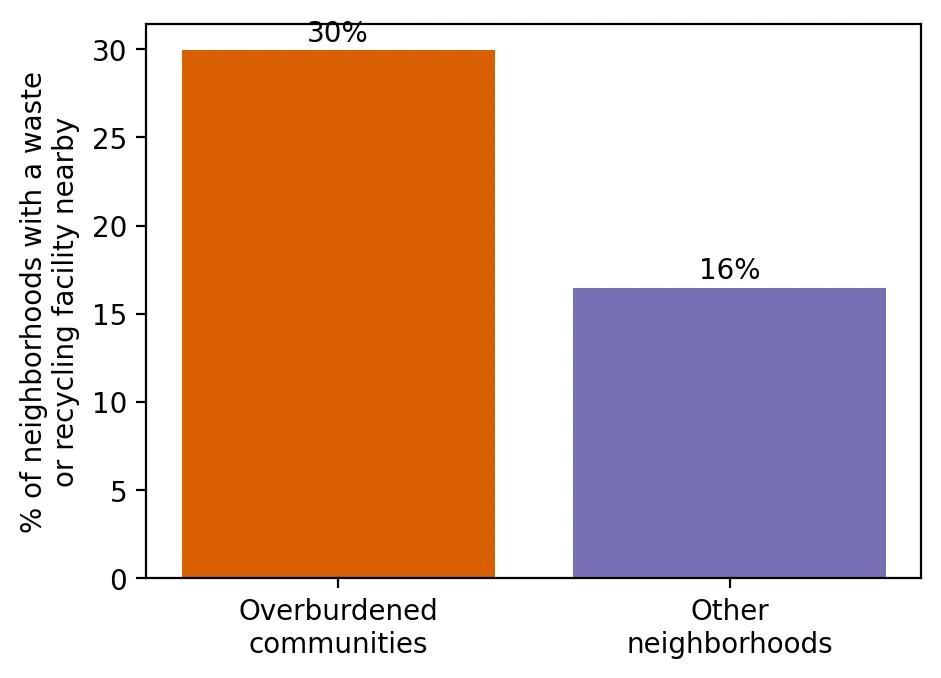
Bar chart of the percent of neighborhoods with a waste or recycling facility nearby: 30% of overburdened communities versus 16% of other neighborhoods.

Where the Trash Goes: Who Lives Near New Jersey's Waste and Recycling Facilities?

Posted on April 23, 2024

Who lives near New Jersey's waste and recycling facilities? Overburdened communities are about twice as likely to have one in the neighborhood. (3 min. read)

Continue reading →: Where the Trash Goes: Who Lives Near New Jersey's Waste and Recycling Facilities?
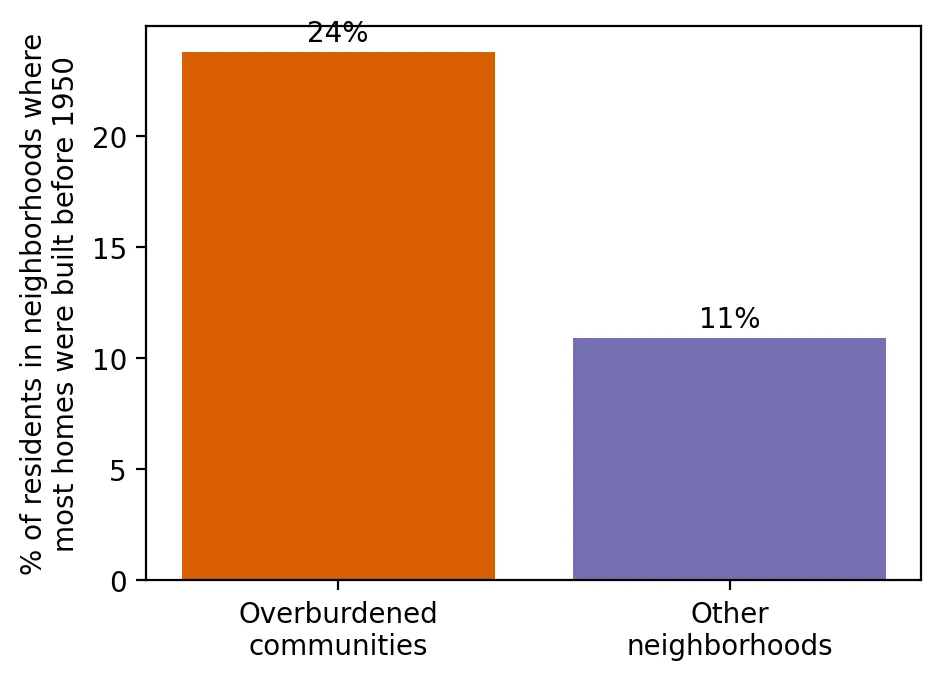
Bar chart of the percent of residents living in neighborhoods where most homes were built before 1950: 24% in overburdened communities versus 11% in other neighborhoods.

Old Homes, Old Paint: Who Lives Where Lead Paint Is Most Likely?

Posted on January 17, 2024

Who lives where lead paint is most likely? A look at pre-1950 housing in New Jersey's overburdened communities compared with other neighborhoods. (3 min. read)

Continue reading →: Old Homes, Old Paint: Who Lives Where Lead Paint Is Most Likely?
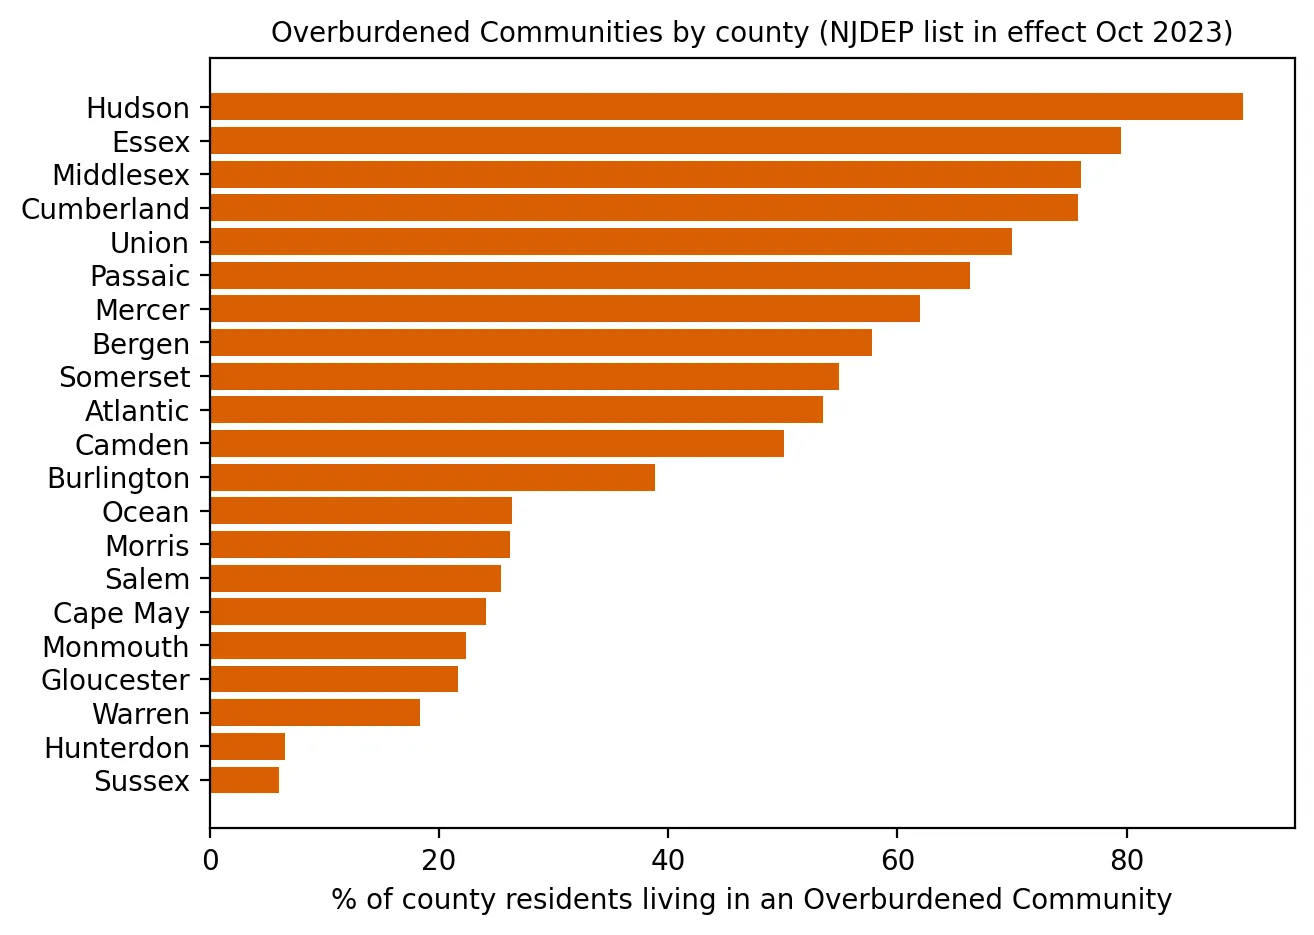
Horizontal bar chart of the percent of each New Jersey county's residents living in an overburdened community, ranging from about 90% in Hudson County and 80% in Essex down to about 7% in Hunterdon and 6% in Sussex.

Environmental Injustice Is Real in New Jersey: Introducing This Project

Posted on October 2, 2023

Introducing a project on environmental injustice in New Jersey, using the state's own data to compare overburdened communities with other neighborhoods. (5 min. read)

Continue reading →: Environmental Injustice Is Real in New Jersey: Introducing This Project

No posts match those filters.

SoilStory

Environmental injustice in New Jersey, told through data and the people who live it.

  • Home
  • Share Your Story
  • Our Story Collection
  • Research
  • Code Projects
  • Our Mission

Get in touch

david.j.chang27@gmail.com

All data comes from public sources, cited in every post.