
Getting the Lead Out: Pipes, Paint, and Children's Blood in New Jersey
Abstract. After Newark’s drinking water crisis, New Jersey committed to removing every lead service line in the state by 2031, and it is making progress: utilities reported about 163,000 lead or galvanized lines in 2022 and about 85,000 in 2026. Pipes are only one route to children’s blood, however. Using New Jersey Department of Health data for children under six in the state’s 67 largest municipalities, I find that elevated blood lead levels are strongly concentrated in towns with old housing and large overburdened populations. In towns where at least 90% of residents live in overburdened communities, 2.1% of tested children had elevated blood lead in 2024, compared with 0.5% in towns where fewer than half do (4.5 times higher). Rates fell statewide by about 39% between 2019 and 2024. Newark’s decline was almost exactly the statewide average, while Trenton, which still has roughly 20,000 lead service lines, improved the least of the large cities and now has the highest rate. The data point to two linked tasks: finishing pipe replacement and confronting the larger, older hazard of lead paint in aging rental housing.
1. No safe level
Lead is a neurotoxin with no known safe level of exposure. In young children, even low blood lead levels are associated with lower IQ, attention problems, and reduced academic achievement, and the damage is largely irreversible. Children under six are most vulnerable because their brains are developing quickly and because they put their hands, toys, and paint chips in their mouths. In 2021, the U.S. Centers for Disease Control and Prevention lowered its blood lead reference value to 3.5 micrograms per deciliter (µg/dL). New Jersey adopted that threshold in 2025; the 2024 data in this post use the previous threshold of 5 µg/dL (New Jersey Department of Health [NJDOH], 2025).
Children are exposed to lead through three main pathways: paint (lead-based paint was banned for residential use in 1978, but it remains in millions of older homes, where it turns into dust and chips), soil (contaminated by old paint, leaded gasoline, and industry), and water (when lead leaches from service lines, the pipes connecting homes to water mains, or from plumbing fixtures).
2. Newark’s crisis and New Jersey’s response
Newark brought the water pathway to national attention. Between 2017 and 2019, lead levels in the city’s tap water rose sharply after the corrosion control treatment at its Pequannock water treatment plant stopped working effectively, allowing lead to dissolve from old service lines. By August 2019, the city was distributing bottled water. Newark then did something few cities had attempted: with help from an Essex County bond, it replaced more than 23,000 lead service lines in under three years, at no direct cost to homeowners, and largely finished by 2021 (WHYY, 2021).
The crisis changed state law. In July 2021, New Jersey required every water system to replace all lead service lines within ten years, by 2031 (P.L.2021, c.183). At the federal level, the EPA’s 2024 Lead and Copper Rule Improvements require nationwide replacement within about a decade; that rule is being challenged in federal court, with oral arguments expected in fall 2026 (ALL4, 2026).
Progress since then has been substantial. According to NJDEP, water systems reported 163,382 lead or galvanized service lines statewide in 2022 and 85,348 in 2026, a decline of nearly half in four years (Figure 3). Some of that decline reflects replacement, and some reflects utilities identifying lines previously listed as “unknown” as non-lead.
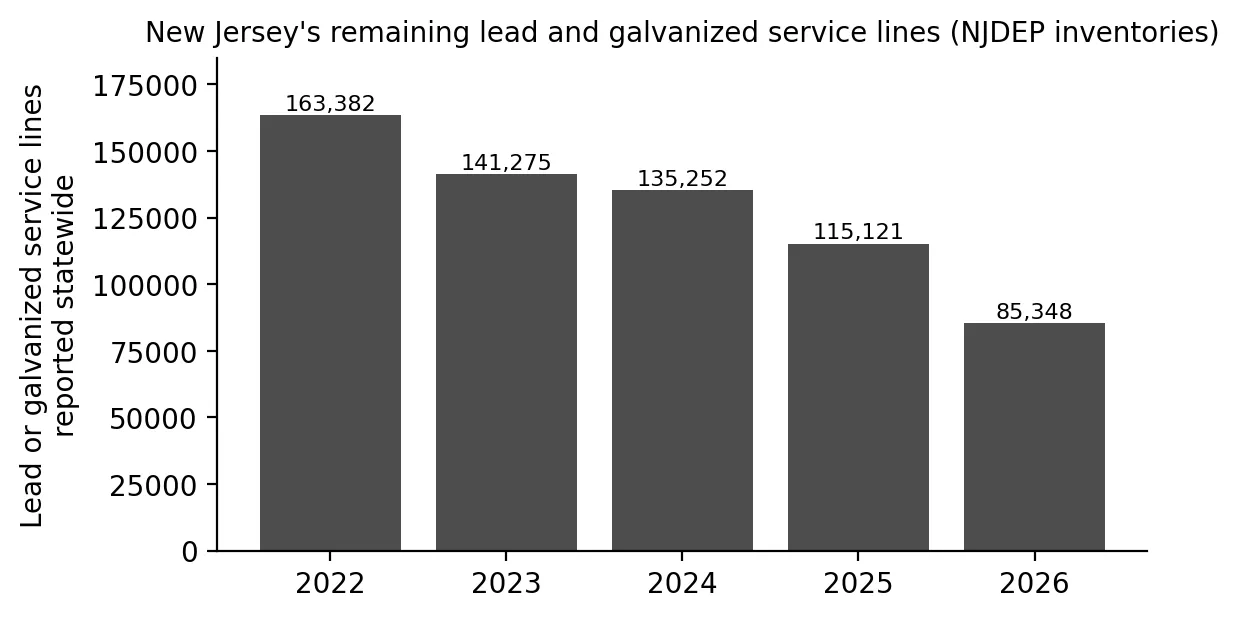 Figure 3. Lead and galvanized service lines reported in New Jersey’s service line inventories (NJDEP).
Trenton illustrates how much work remains. Trenton Water Works, which serves the capital and parts of four neighboring towns, has removed more than 10,000 lead service lines since 2020, but about 20,000 properties still had known lead lines as of August 2025 (Community News, 2025; Gusciora, 2026). At $5,000 to $10,000 per line, the utility estimates its total program at about $175 million. In 2026, Trenton closed on a $15.2 million state loan to replace about 2,000 more lines (NJ Water Bank, 2026).
3. Data and methods
Full code is in code/.
- Children’s blood lead. I extracted municipal tables from NJDOH’s Childhood Lead Exposure in New Jersey annual reports for state fiscal years 2019 and 2024. They report, for every municipality with more than 35,000 residents, the number of children under six who were tested and the number with elevated blood lead levels (EBLL, ≥ 5 µg/dL).
- Old housing. I used two measures: the share of housing units built before 1950 (from the American Community Survey, via NJDEP’s environmental justice data) and the share of tax parcels with buildings constructed before 1950 (from NJDEP’s Potential Lead Exposure Mapping data).
- Overburdened communities. I calculated the share of each municipality’s population living in an overburdened community (see Post 1).
4. Results
Where elevated blood lead is concentrated
In 2024, 2,531 New Jersey children under six had elevated blood lead. The 67 large municipalities account for 71% of them. The cities with the most cases were Newark (318), Trenton (203), Jersey City (144), Paterson (127), and Irvington (127). Measured by rate, Trenton (5.1%) and Irvington (4.1%) were highest, followed by East Orange (3.1%), the only large municipalities more than twice the statewide rate of 1.4%.
Old housing and overburdened communities predict it
Across the 67 municipalities, the elevated blood lead rate rises with the share of old housing and, even more strongly, with the share of residents living in overburdened communities (Figure 1):
| Predictor | Spearman correlation with EBLL rate |
|---|---|
| % of housing units built before 1950 | 0.54 |
| % of parcels built before 1950 | 0.53 |
| % of residents in an overburdened community | 0.68 |
Grouping municipalities shows the size of the gap:
| Group of large municipalities | Children tested with EBLL (pooled) |
|---|---|
| Quarter with the most pre-1950 housing | 1.95% |
| Quarter with the least pre-1950 housing | 0.42% |
| ≥ 90% of residents in overburdened communities (30 towns) | 2.14% |
| < 50% of residents in overburdened communities (23 towns) | 0.48% |
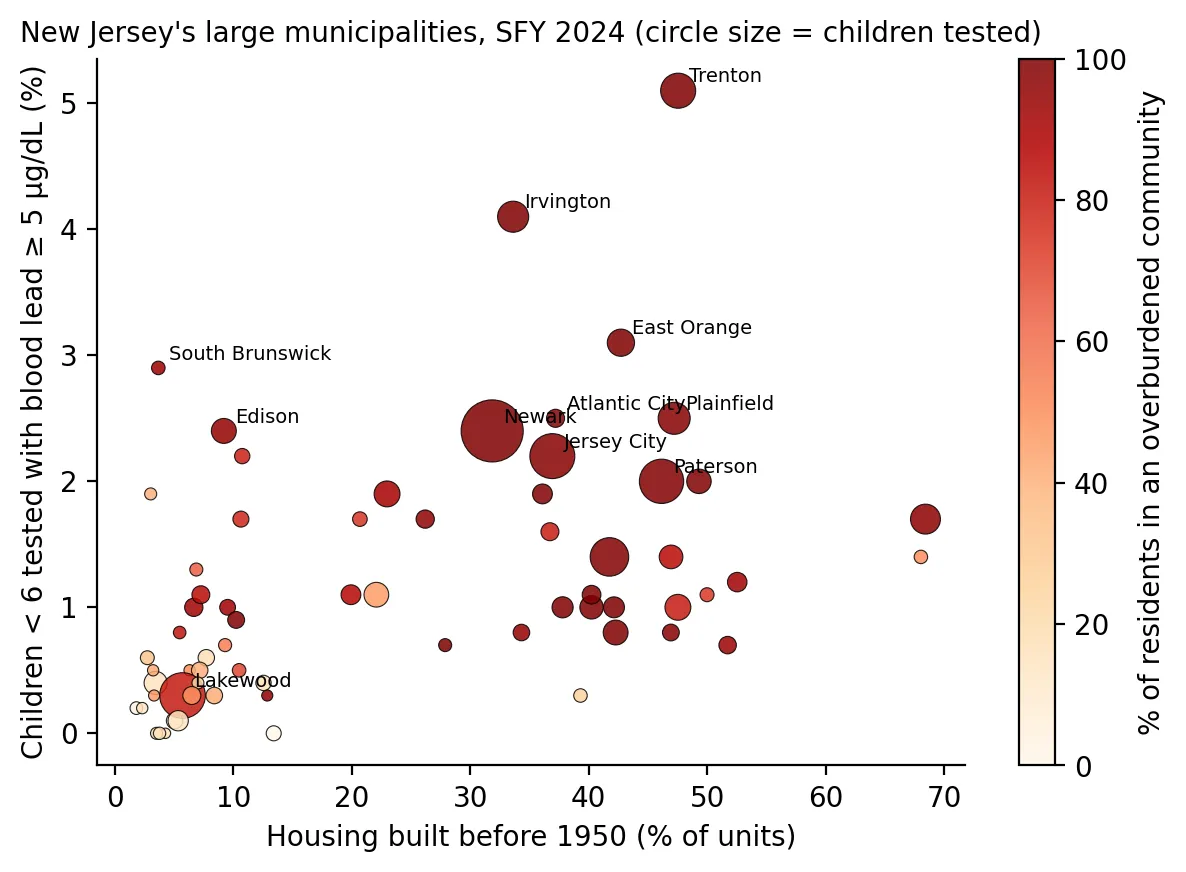 Figure 1. Elevated blood lead among children under six versus pre-1950 housing, for New Jersey’s 67 large municipalities (SFY 2024). Color shows the share of residents in overburdened communities.
Two exceptions in Figure 1 are informative. South Brunswick and Edison have relatively little pre-1950 housing but above-average rates, which suggests that sources other than old paint and pipes, such as certain imported spices, cosmetics, or traditional remedies that public health agencies have linked to lead exposure, may matter in some communities. Lakewood is a large overburdened community with a very low rate. Being overburdened is a strong predictor, but not a deterministic one.
Getting better everywhere, but not equally
Between 2019 and 2024, the statewide rate fell from 2.3% to 1.4%, a 39% decline, and the large municipalities together fell by a similar 36%. Every city in Figure 2 improved.
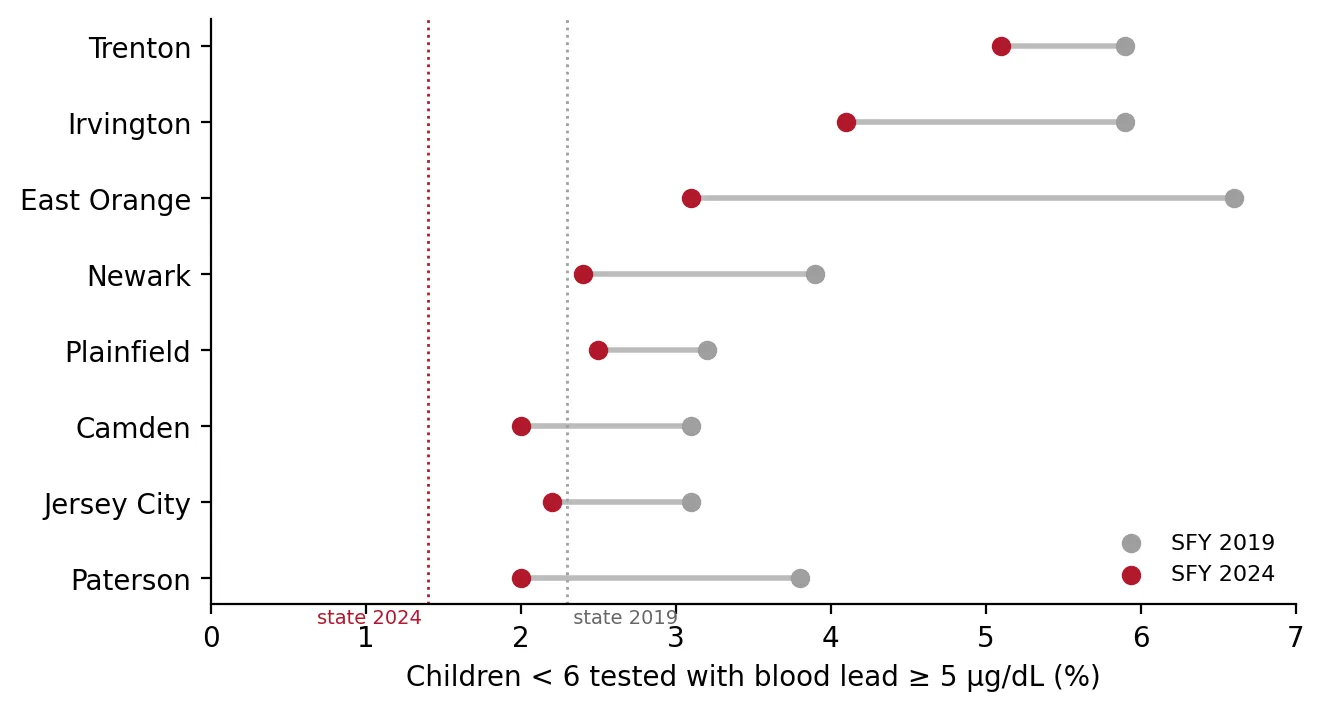 Figure 2. Share of tested children under six with elevated blood lead, SFY 2019 and SFY 2024. Dotted lines show statewide rates.
Newark’s rate fell from 3.9% to 2.4%. That decline coincided with the city’s replacement of its lead service lines, but it is almost exactly the statewide average decline (−38% vs. −39%), with nearly the same number of children tested (about 13,100). The data therefore cannot show that pipe replacement caused Newark’s improvement. Statewide factors, such as housing turnover, abatement, and changes in testing, affected every city at the same time.
Trenton stands out in the opposite direction. Its rate fell only from 5.9% to 5.1% (−14%), the smallest improvement among the large cities, and it is now the highest in the state. Trenton also has one of the largest remaining inventories of lead service lines. That pattern is consistent with water being one contributor, but Trenton also has old housing, high poverty, and lower-quality rental stock, so this comparison cannot separate the causes.
5. Why paint still matters
When a child in New Jersey has an elevated blood lead level, the local health department inspects the home for lead-based paint, leaded dust, soil, and water, and orders abatement of any hazards it finds. In 2024, local health departments handled 894 such cases, and 41% resulted in an abatement order. Newark (107 cases) and Trenton (69) had the most (NJDOH, 2025). NJDOH notes that abatement can take years when property owners are hard to reach, resist enforcement, or cannot afford the work.
This points to an equity issue that pipe replacement alone will not solve. Old housing, especially old rental housing, is concentrated in the same overburdened communities where children’s lead levels are highest. Renters cannot remove lead paint from homes they do not own. New Jersey’s 2021 lead paint law, which requires inspections of many pre-1978 rental units, takes aim at this problem, but its effectiveness depends on enforcement in exactly these cities.
6. Limitations
- Testing is not universal. Only 30% of New Jersey children under six were tested in 2024, ranging from about 20% in some suburbs to more than 60% in Irvington and Plainfield. NJDOH warns that comparing municipal rates can be misleading because testing practices differ.
- Ecological comparison. These are town-level correlations. They do not show that the specific children with elevated blood lead lived in old housing or overburdened neighborhoods.
- Large towns only. Municipal tables cover only municipalities with more than 35,000 residents.
- Service line counts. Statewide inventories are self-reported and change as utilities identify unknown lines. I could not obtain system-level inventories to test directly whether remaining lead pipes predict children’s blood lead.
7. Conclusion
New Jersey is on track to eliminate one major source of lead exposure. The number of reported lead and galvanized service lines fell by almost half between 2022 and 2026, and Newark showed that rapid replacement is possible. But children’s blood lead tells a broader story: elevated levels are concentrated in old, overburdened cities, where peeling paint, dust, soil, and aging pipes overlap. Trenton, with the highest rate and one of the largest remaining pipe inventories, shows what is at stake if the 2031 deadline slips. Getting the lead out will require finishing the pipes and fixing the homes.
Data and methods
The analysis was done in Python with public data. The full code, its data, and every figure it produces are in the code project below.
References
- ALL4. (2026). Lead and Copper Rule Improvements update. https://www.all4inc.com/4-the-record-articles/lead-copper-rule-improvements-update/
- Community News. (2025). Trenton Water Works begins new phase of lead pipe replacements. https://communitynews.org/?p=359452
- Gusciora, W. R. (2026, March). Trenton pushes forward on lead pipe removal with sixth phase of replacements. https://news.nationgraph.com/articles/trenton-pushes-forward-on-lead-pipe-removal-with-sixth-phase-of-replacements
- New Jersey Department of Environmental Protection. (2026). Lead exposure reduction: By the numbers and Potential Lead Exposure Mapping (PLEM). https://dep.nj.gov/lead/map/
- New Jersey Department of Health. (2020). Childhood lead exposure in New Jersey: Annual report, state fiscal year 2019. https://www.nj.gov/health/childhood-lead/documents/childhood-lead-2019-annual-report.pdf
- New Jersey Department of Health. (2025). Childhood lead exposure in New Jersey: Annual report, state fiscal year 2024. https://www.nj.gov/health/childhood-lead/documents/childhood-lead-2024-annual-report.pdf
- New Jersey Water Bank. (2026, June 23). Trenton City lead service line replacement, Phase 6. https://www.njib.gov/news/trenton-city-lead-service-line-replacement-phase-6-6a340149959e7
- P.L.2021, c.183 (N.J. 2021). An act concerning the replacement of lead service lines.
- WHYY. (2021). After drinking water crisis, Newark is winning war on lead. https://whyy.org/articles/after-drinking-water-crisis-newark-is-winning-war-on-lead